


Century 21 People’s Choice Realty Inc., Brokerage
120 MATHESON BLVD E #103
MISSISSAUGA, Ontario
L4Z 1X1
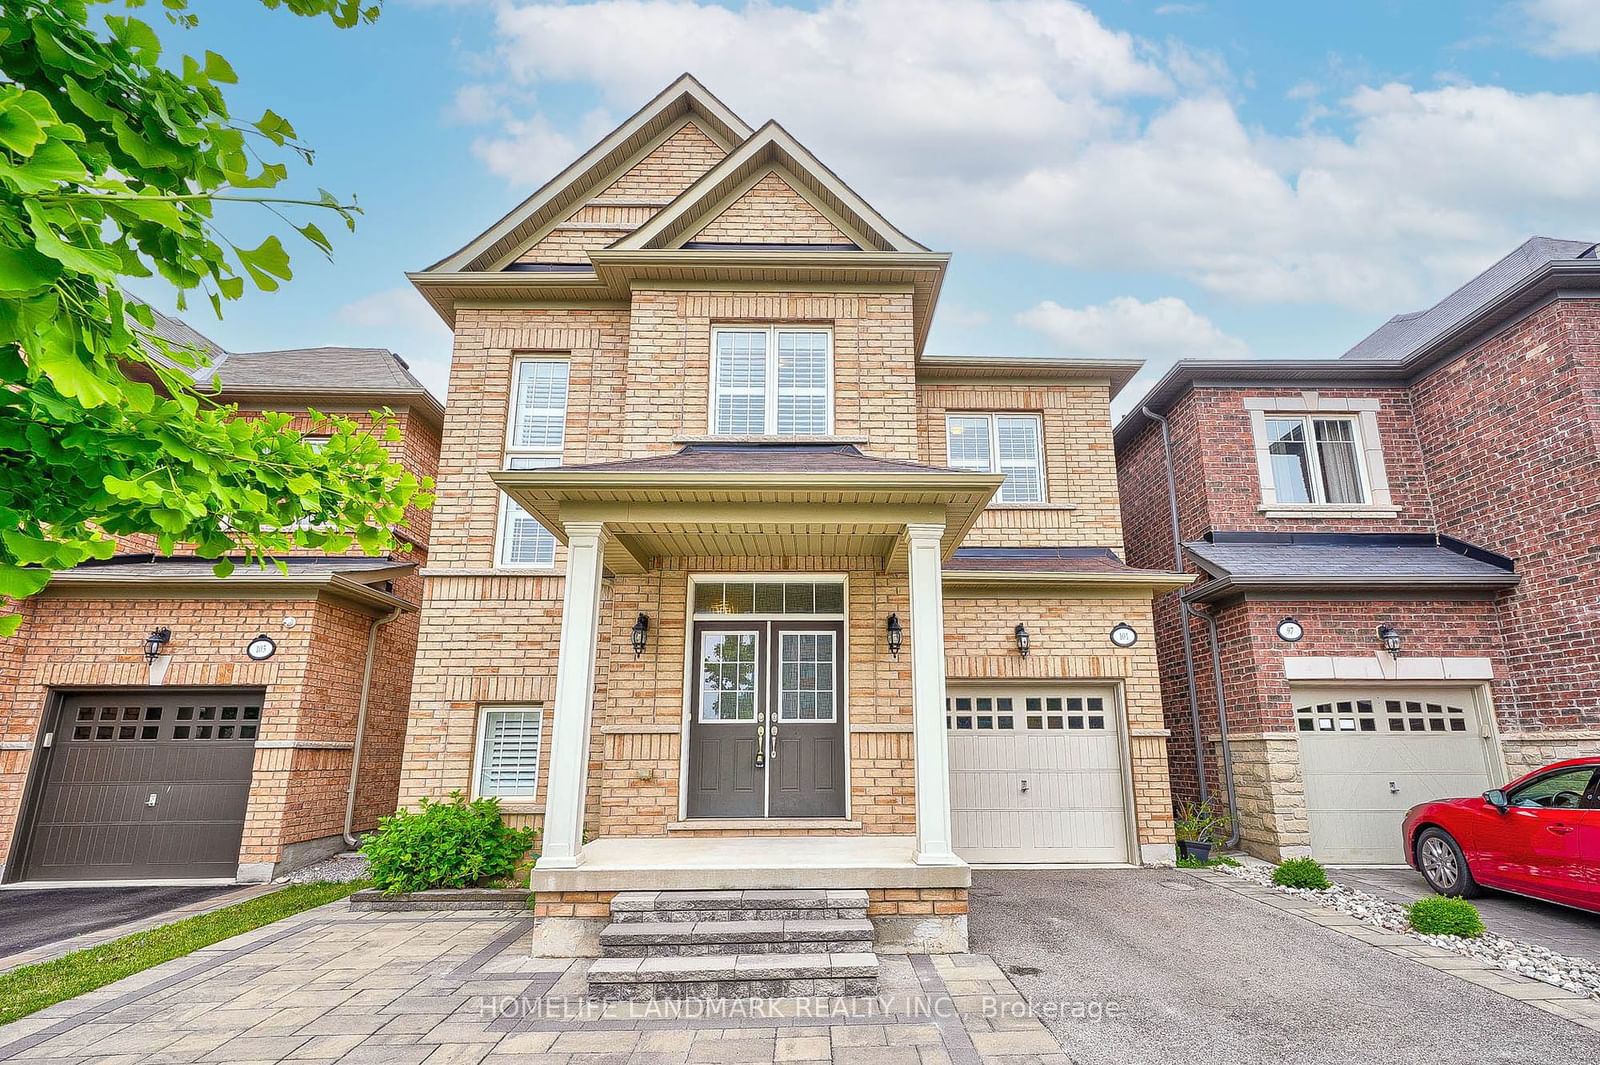
Oakville, RO River Oaks, L6H 6C4
$1,549,000
Listed by REAL ONE REALTY INC..
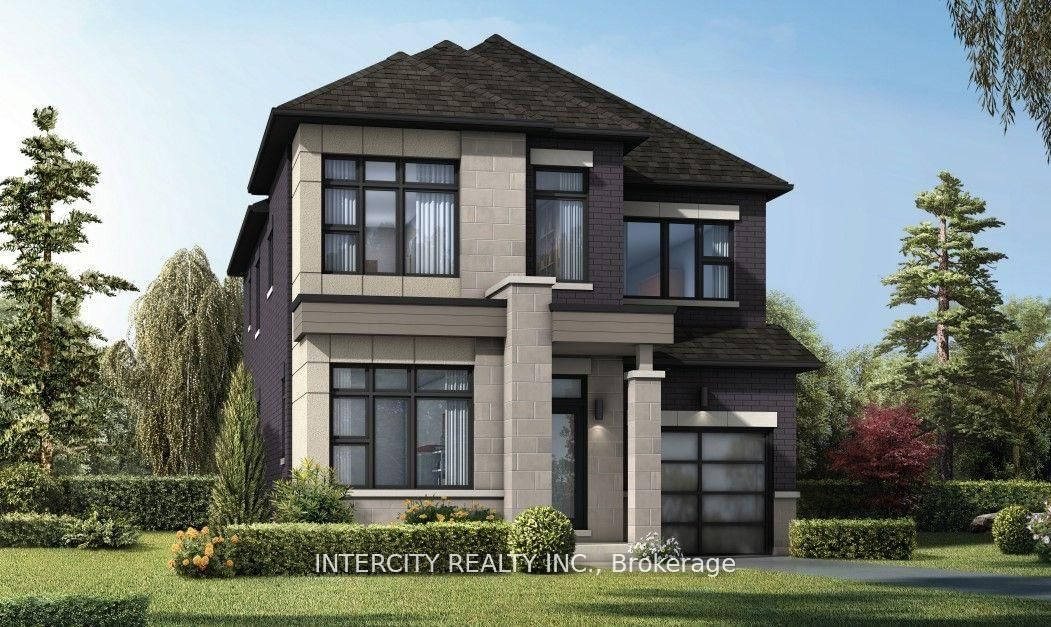
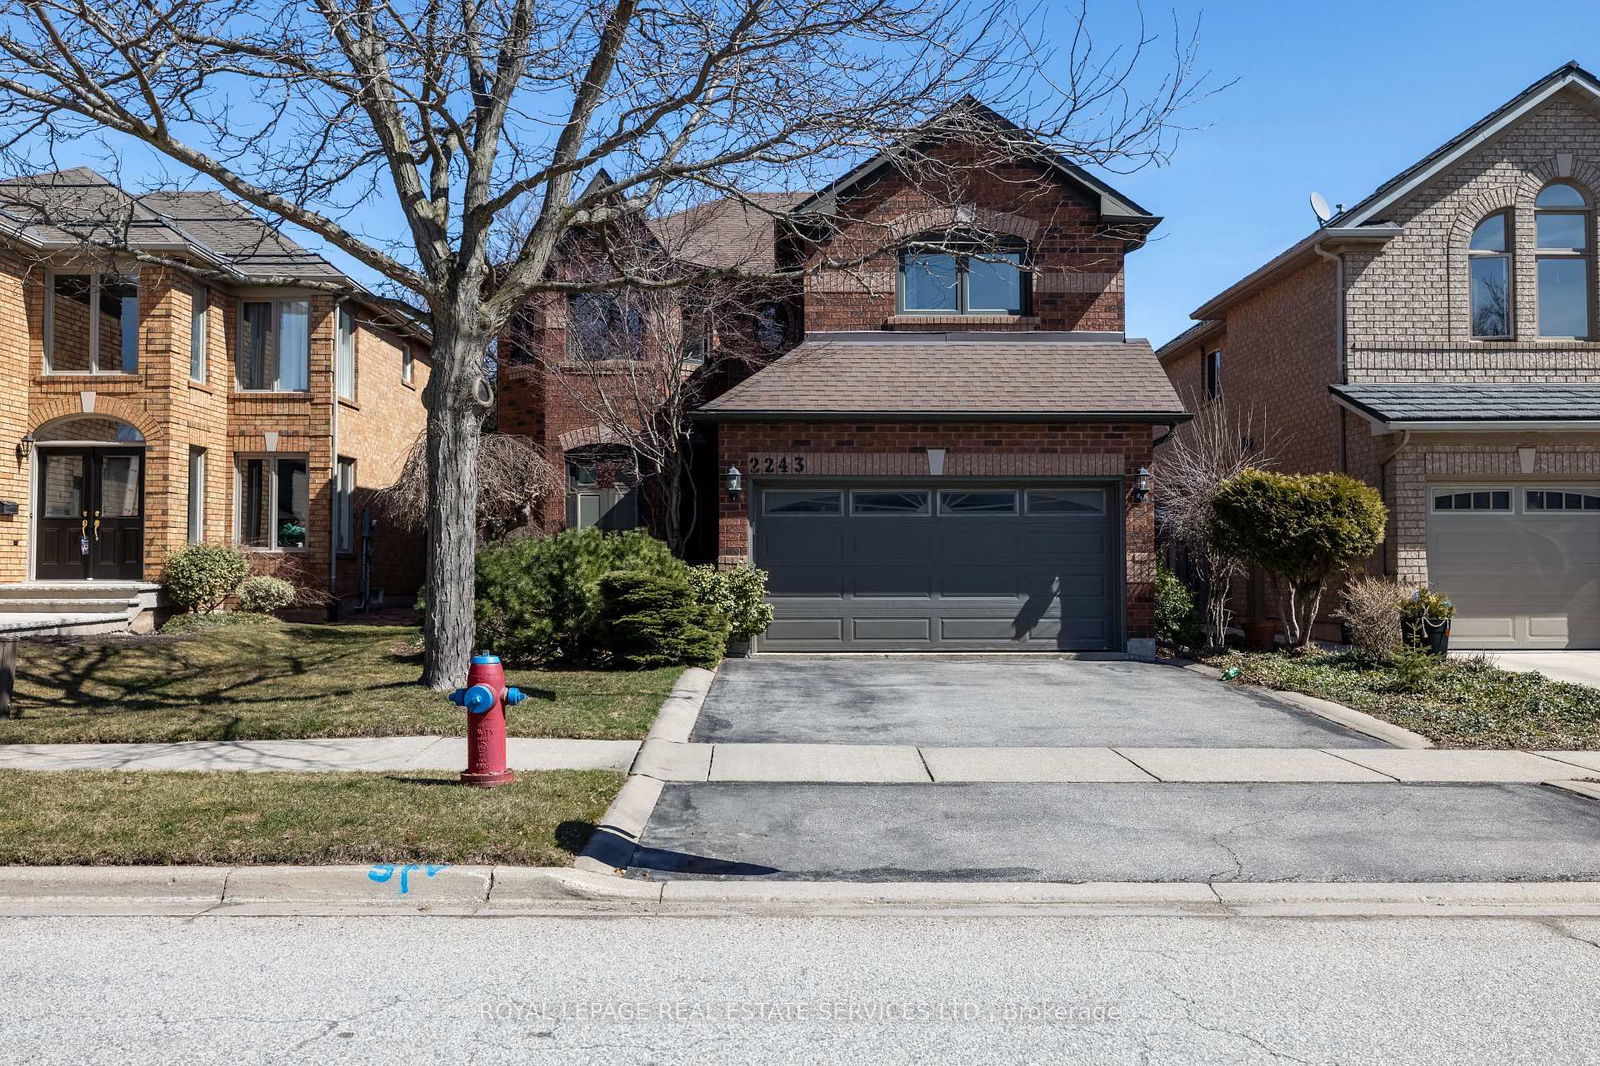
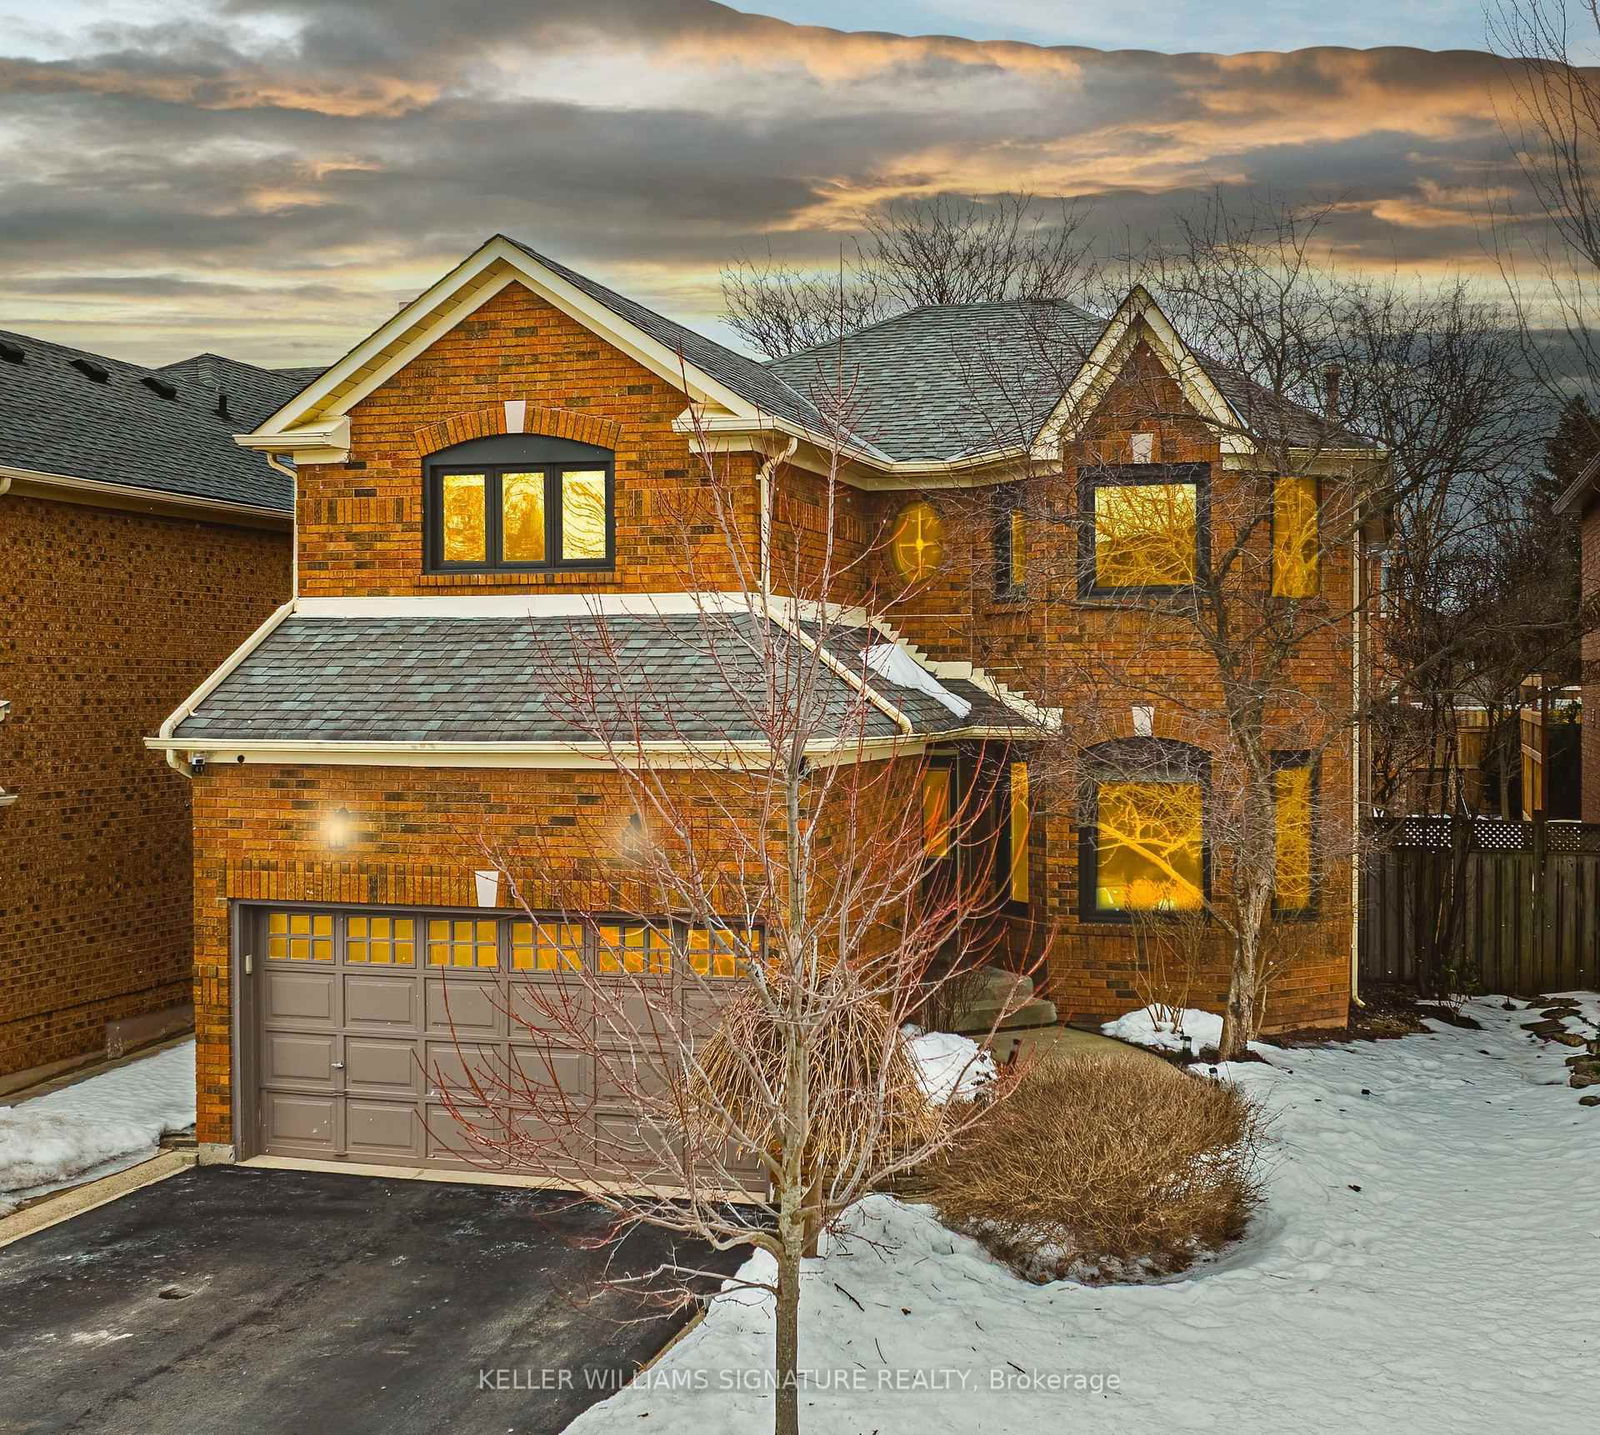
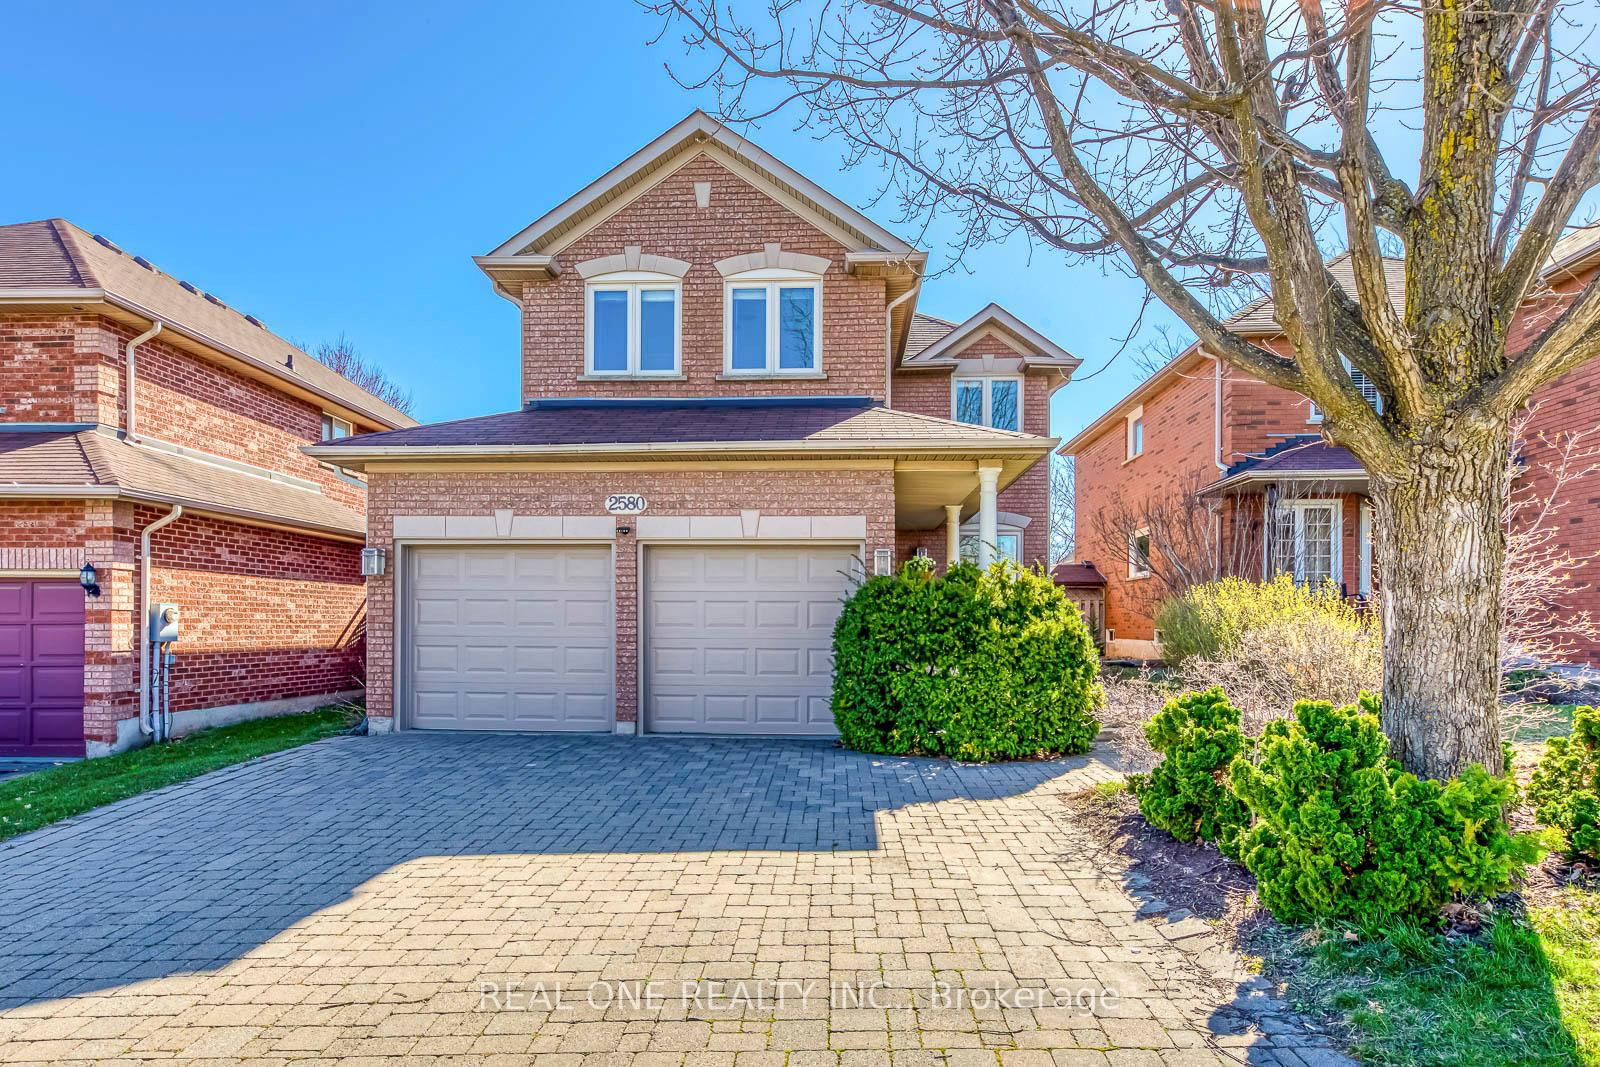
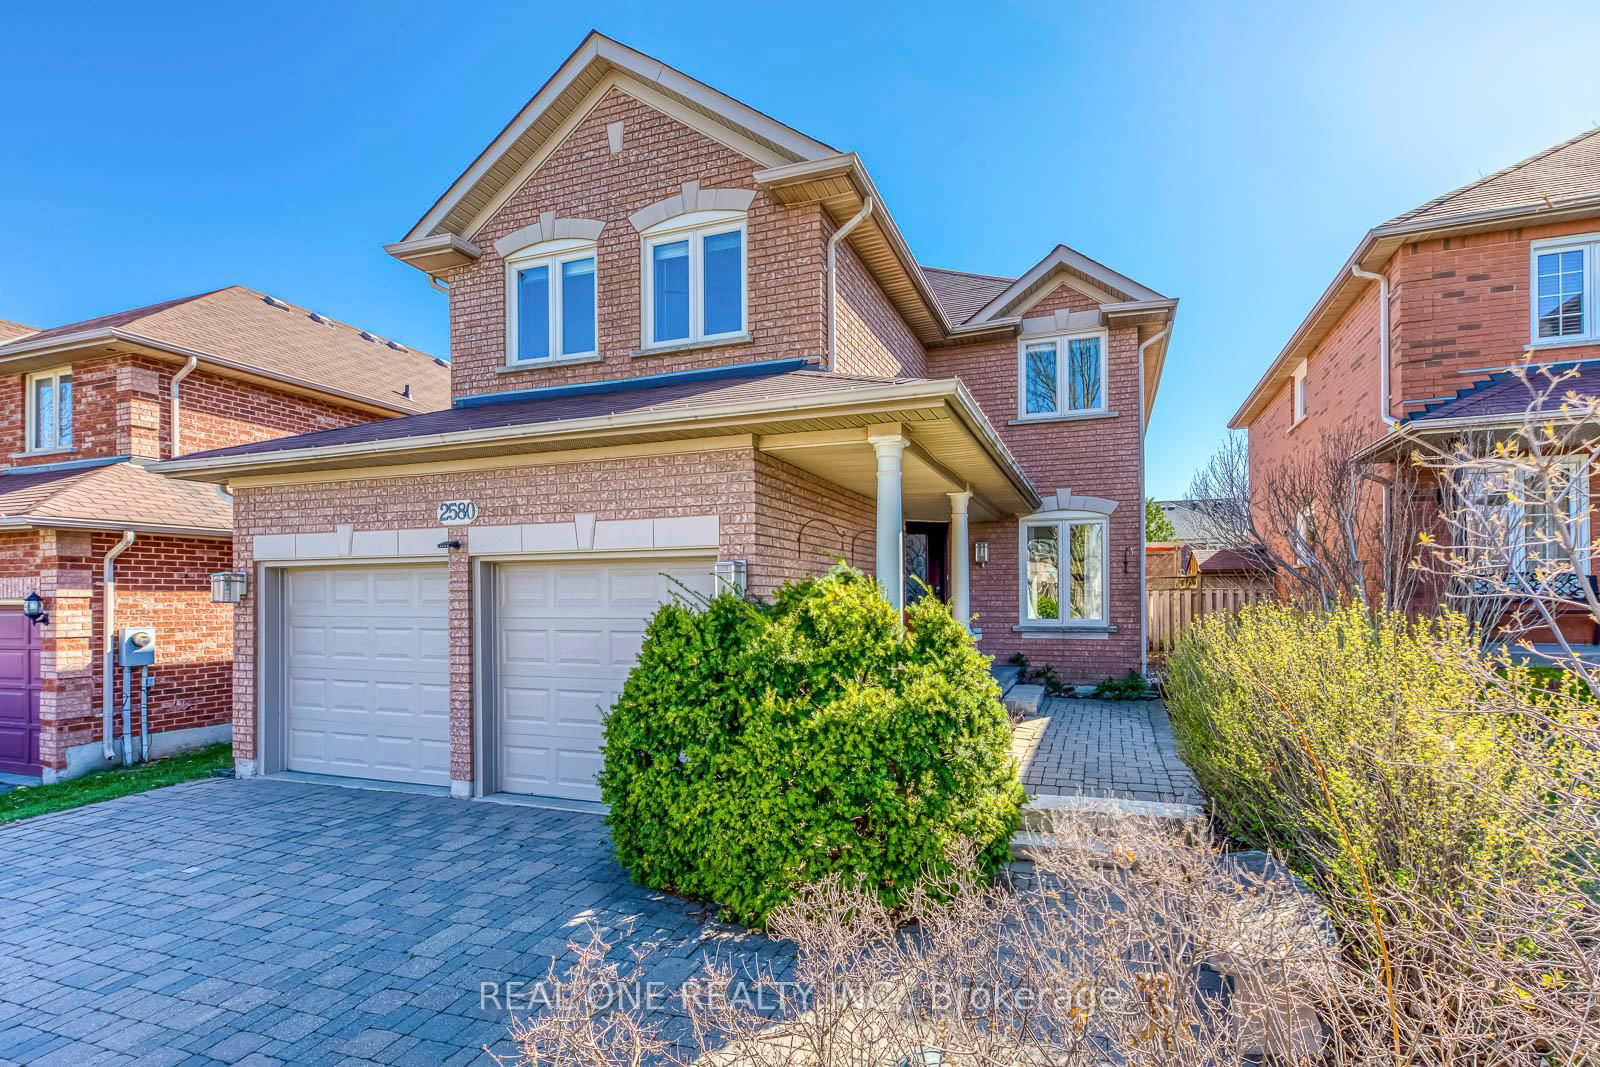
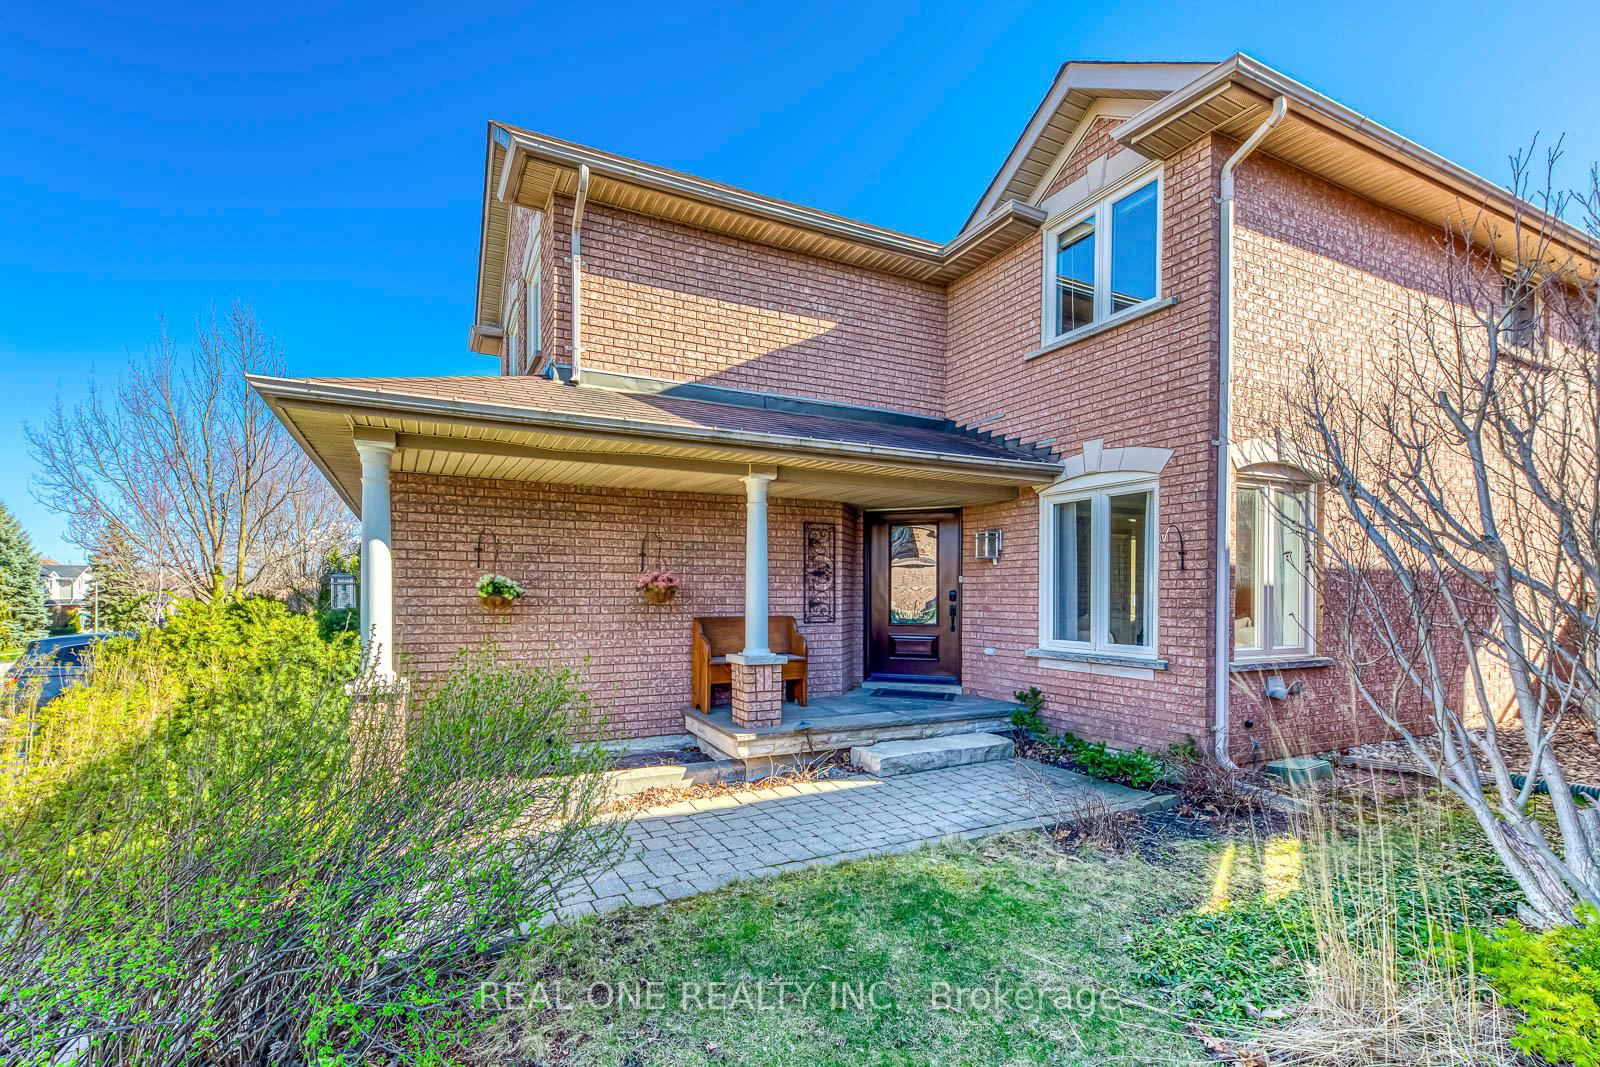
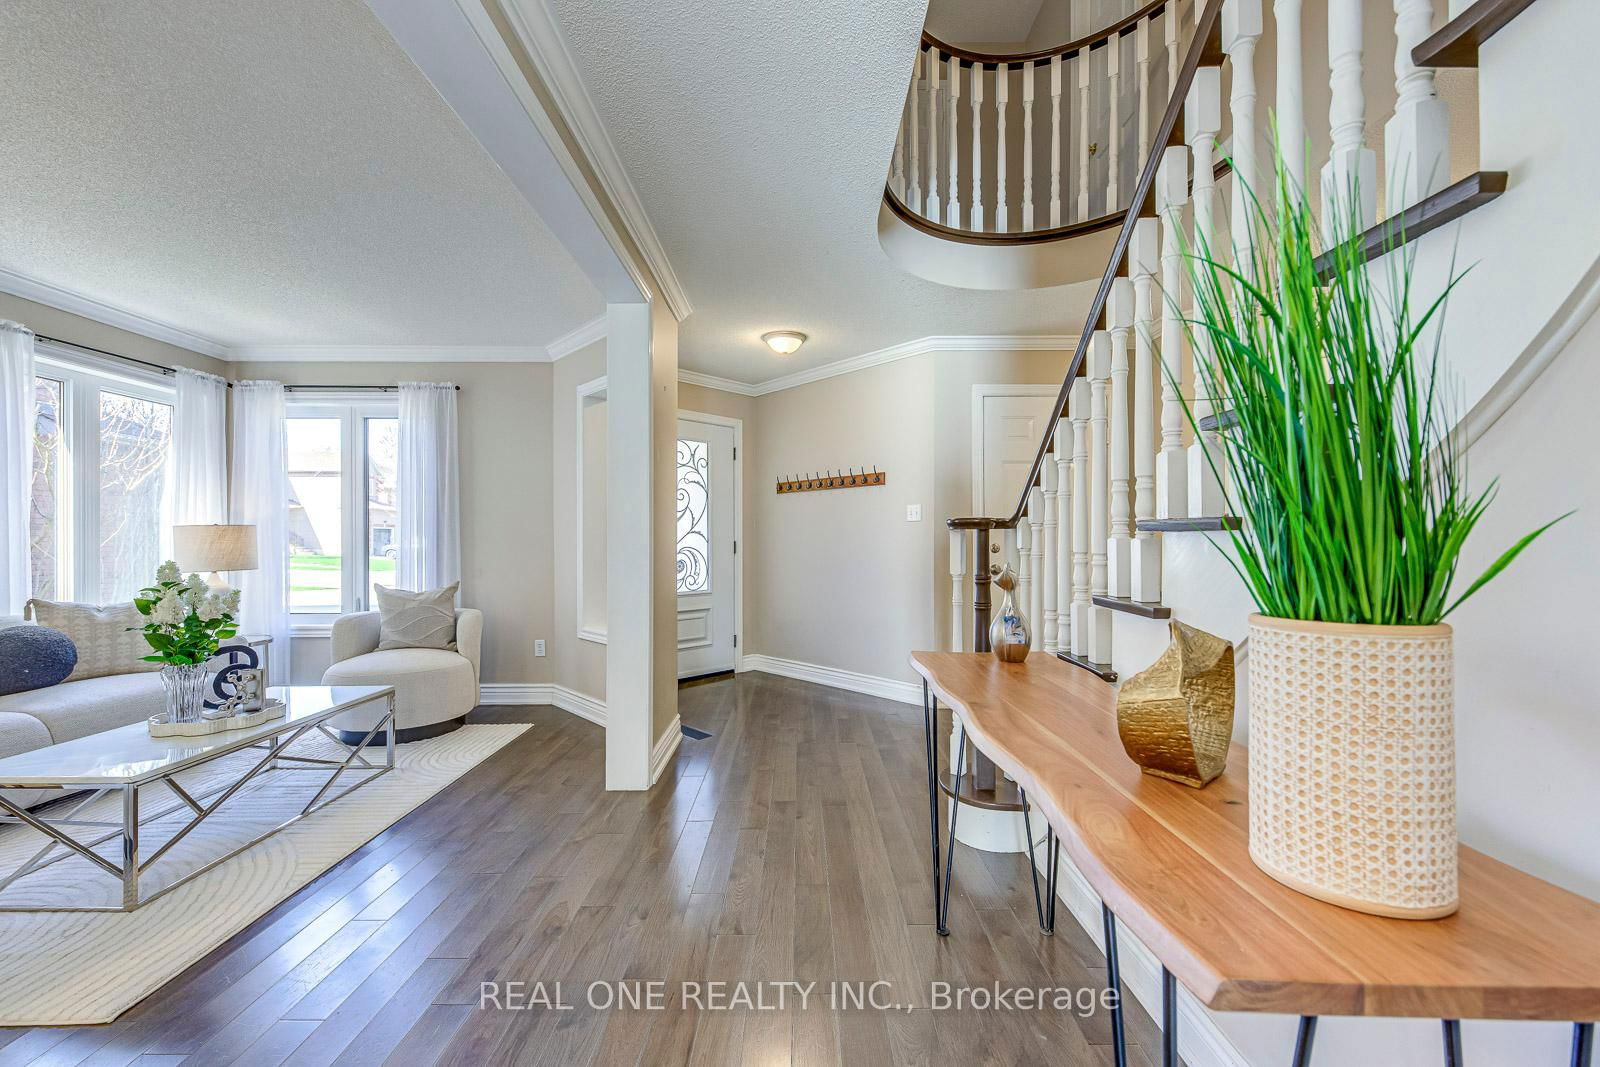
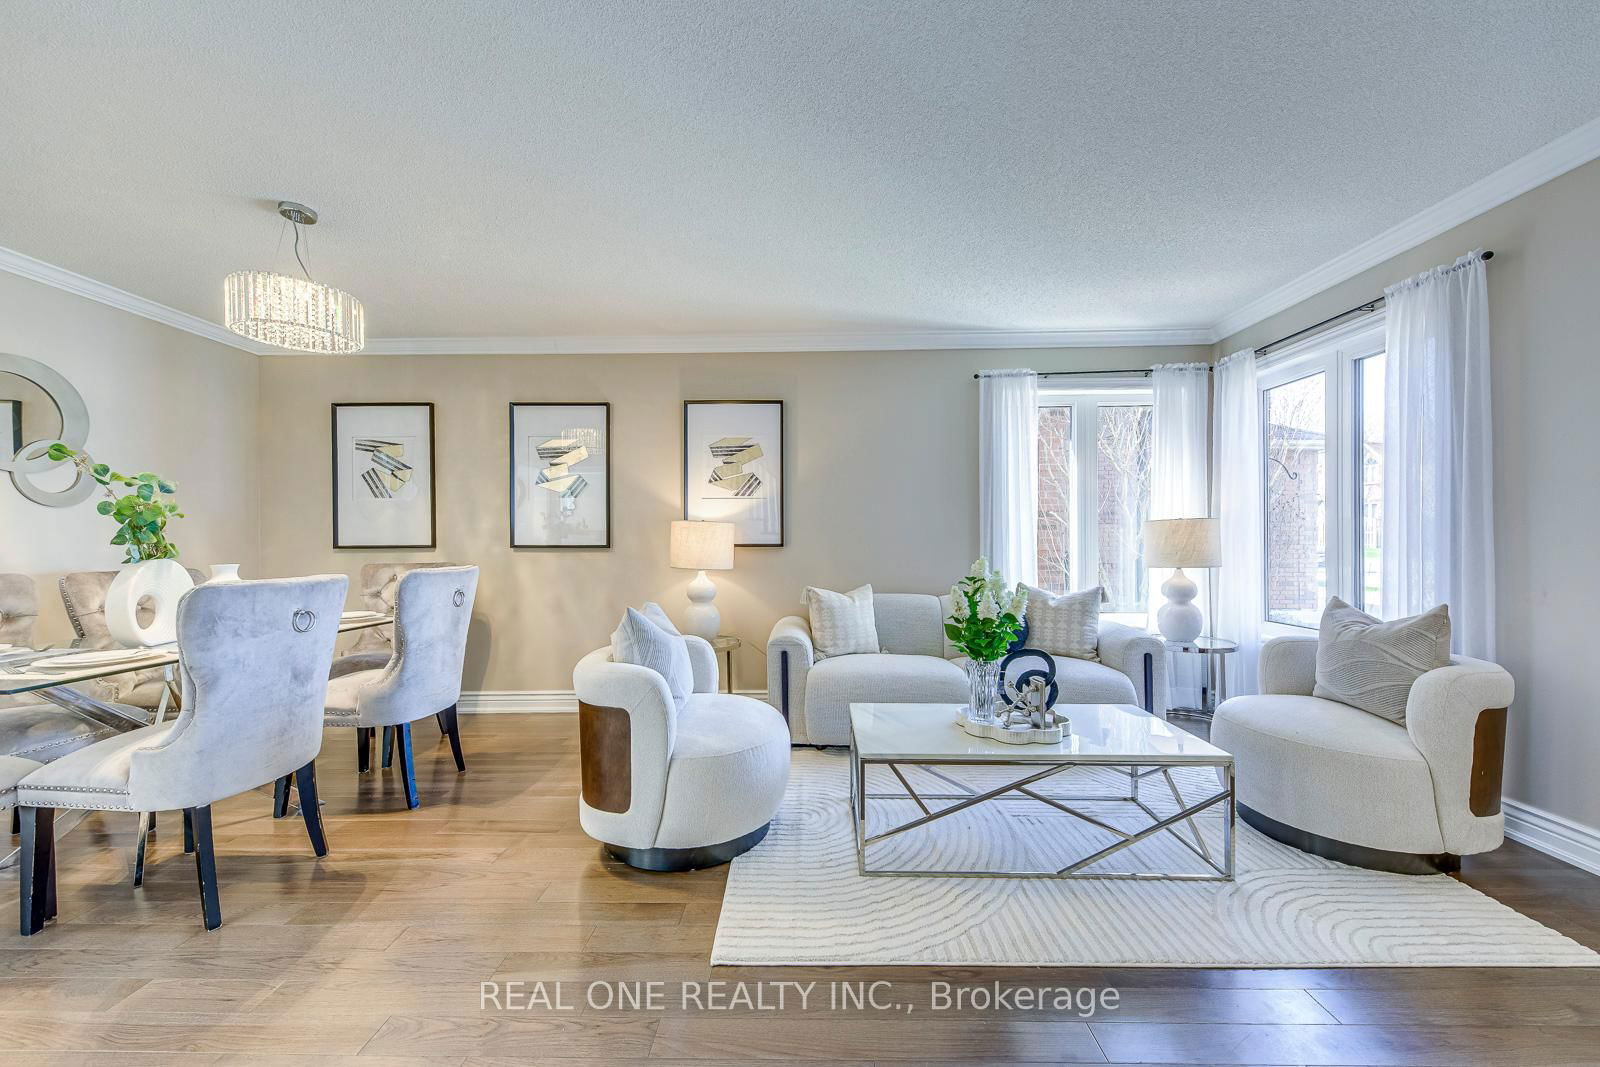
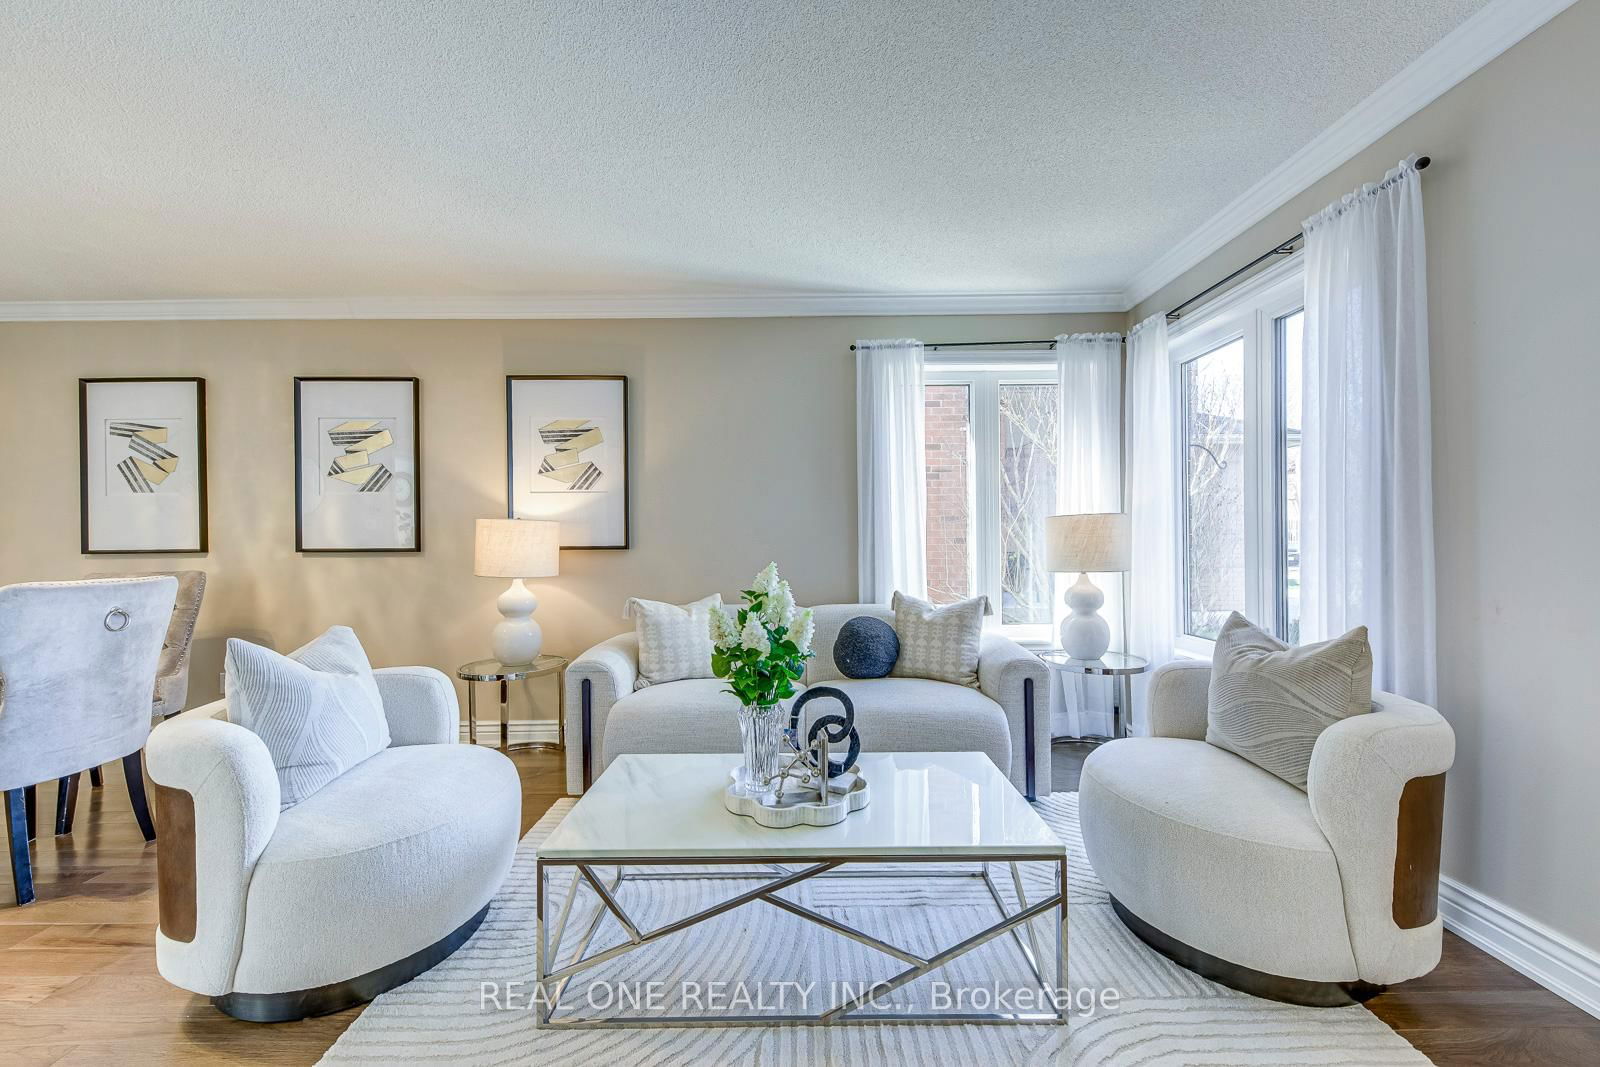
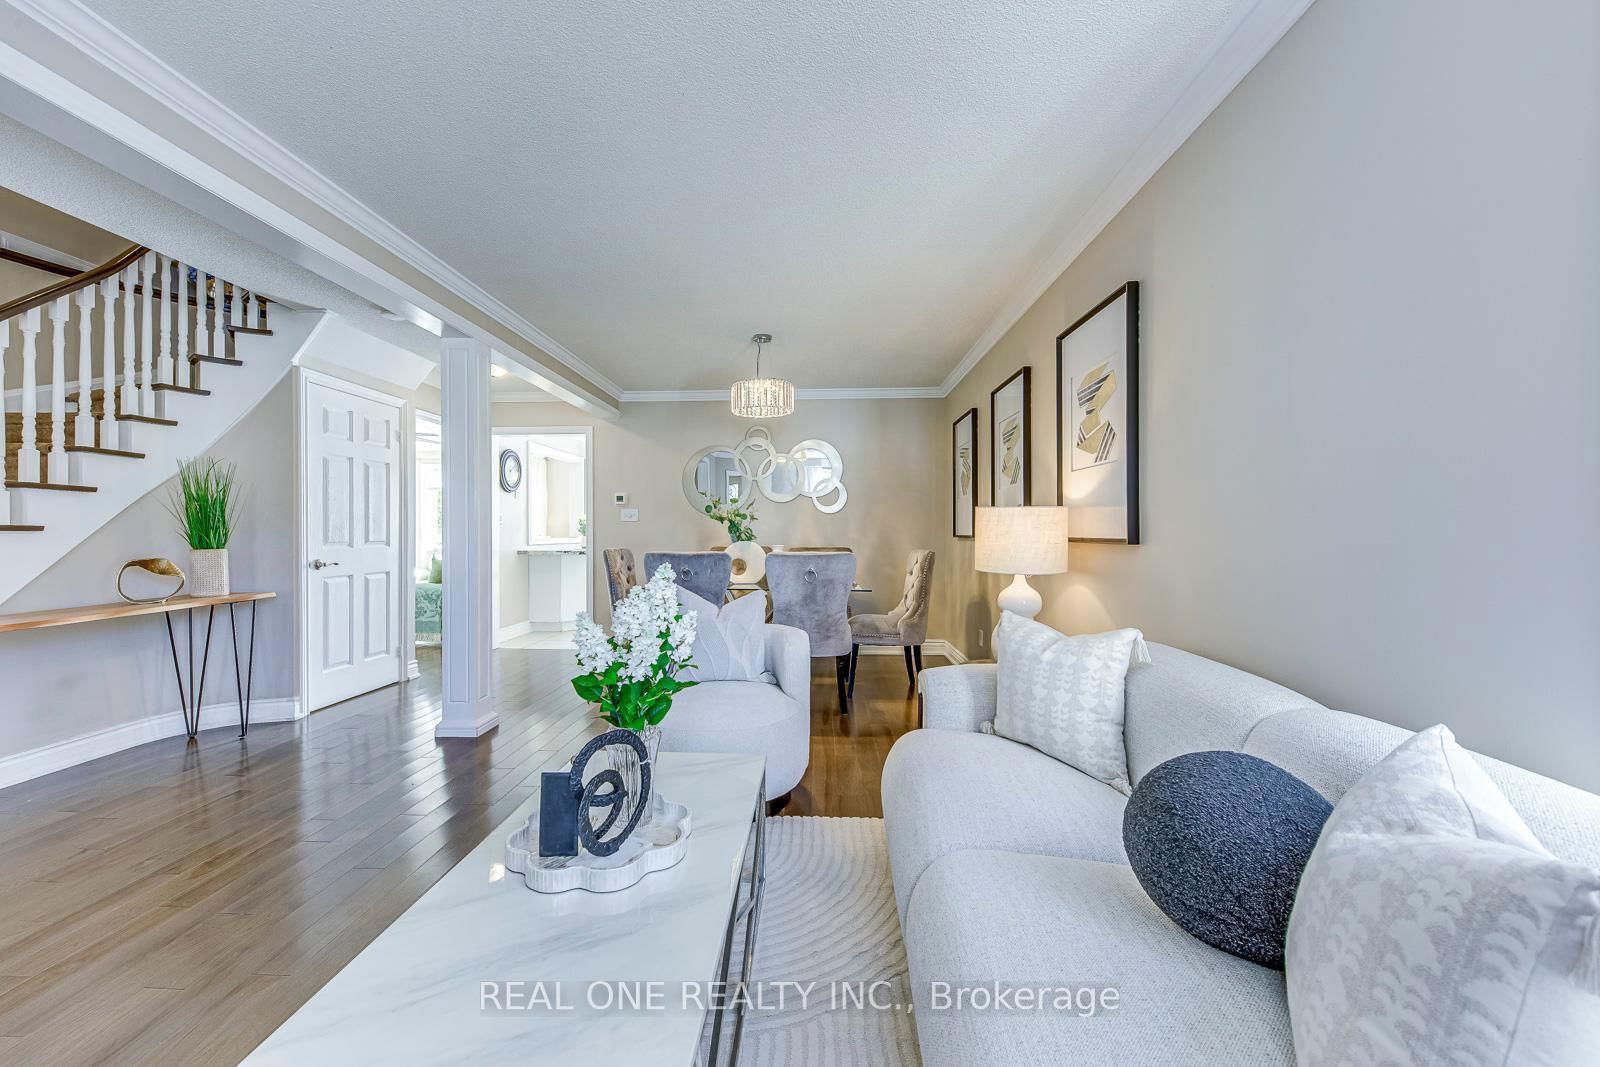
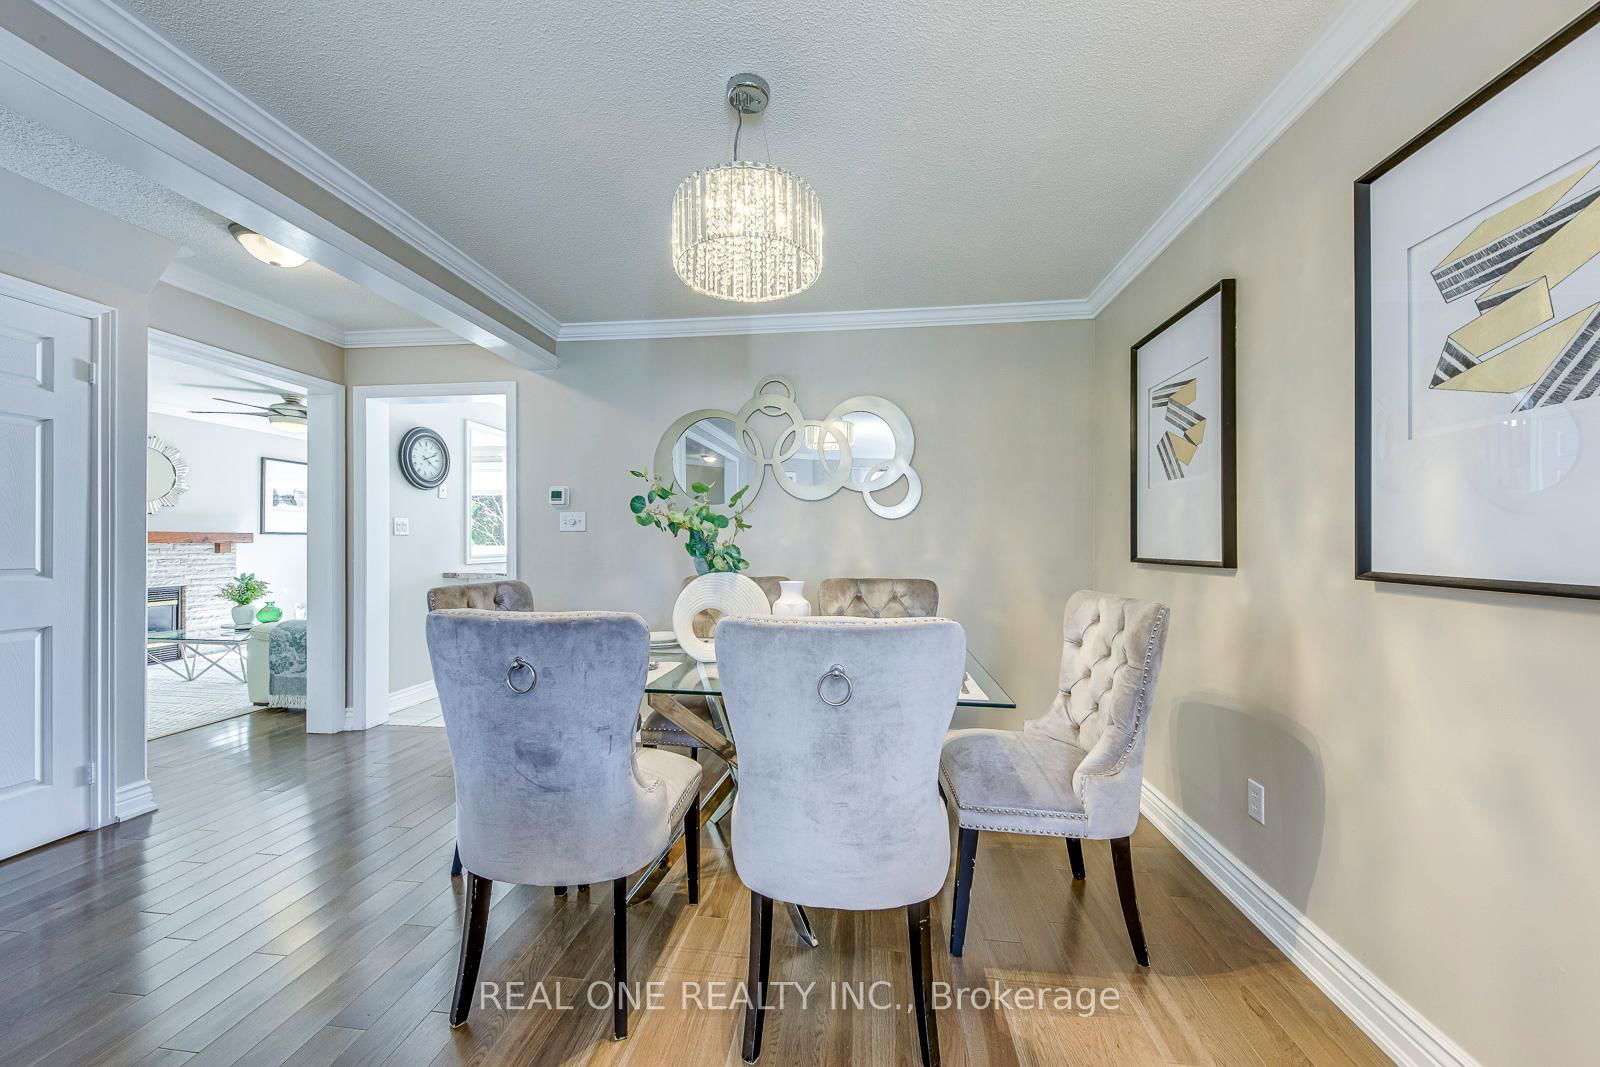
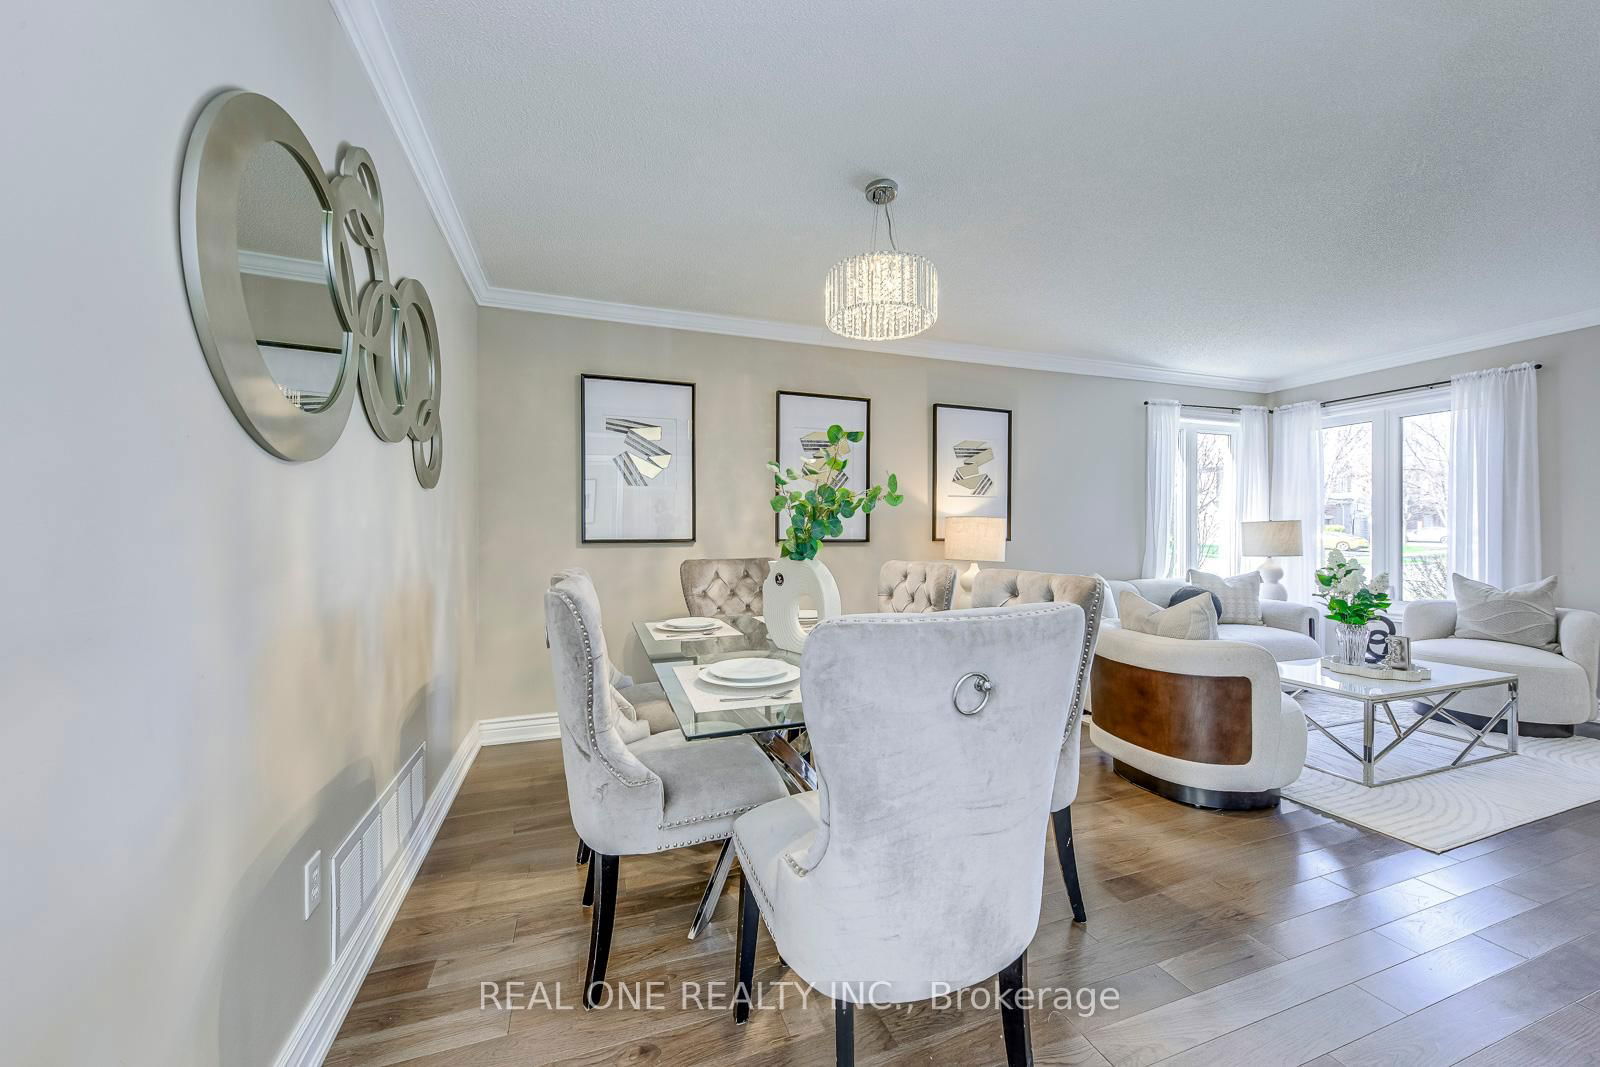
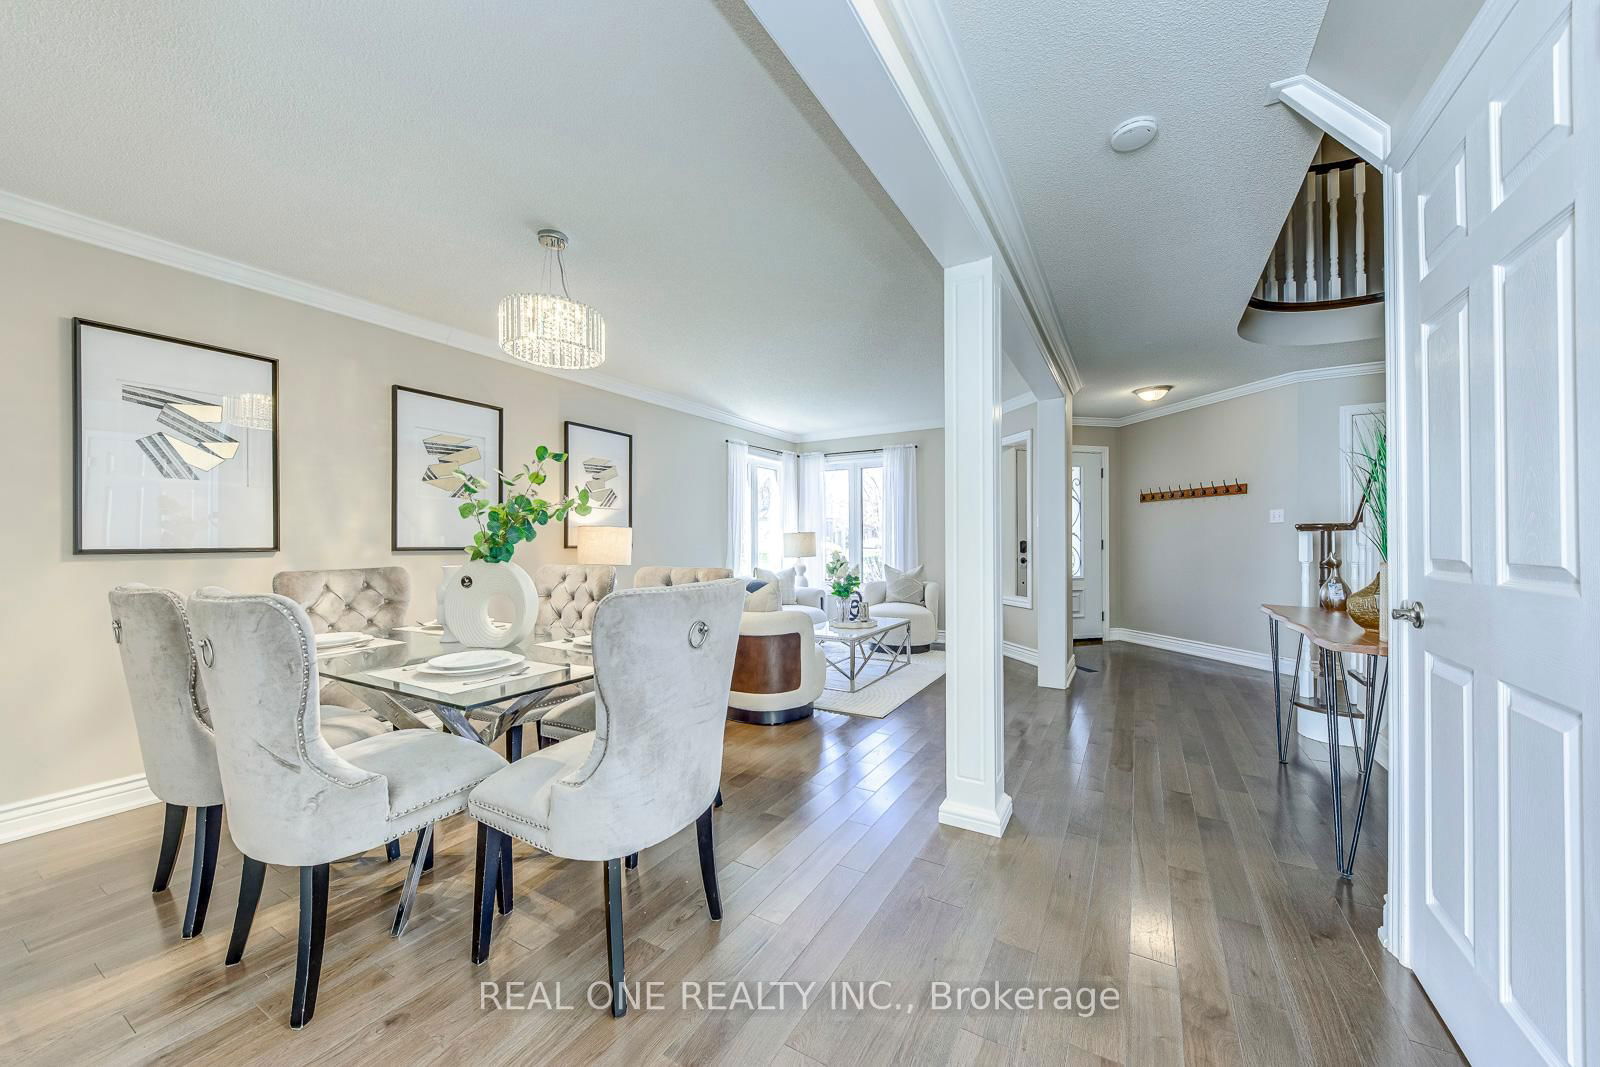
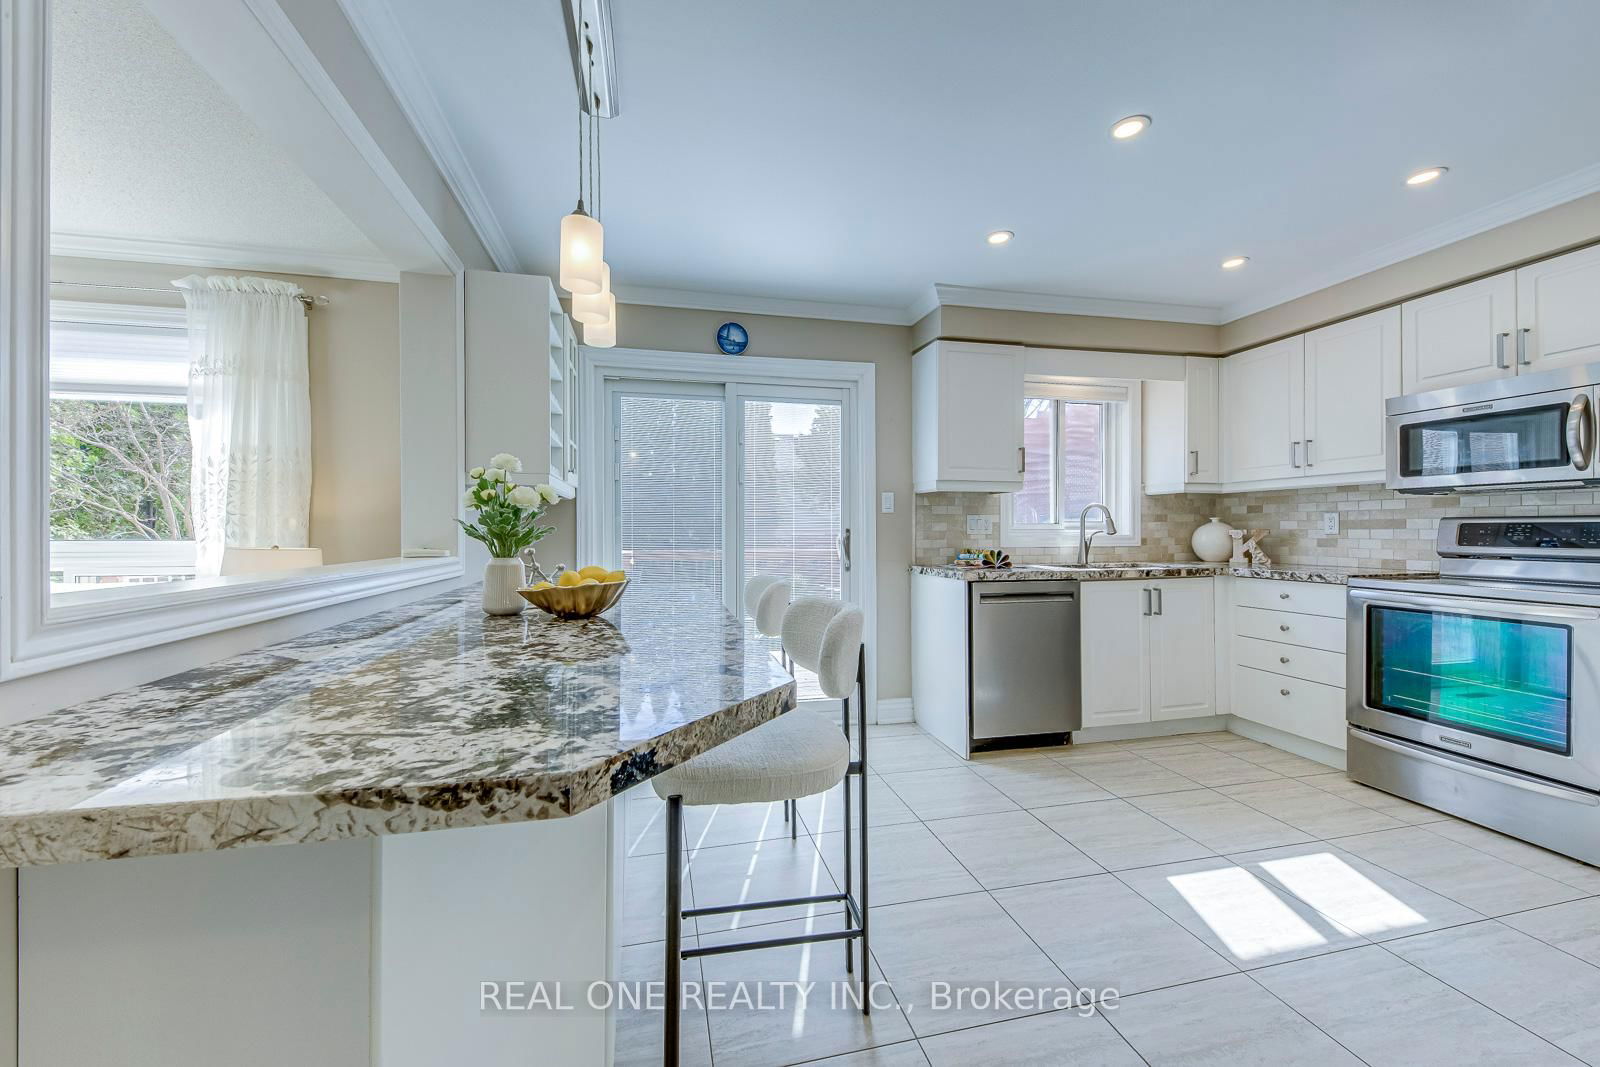
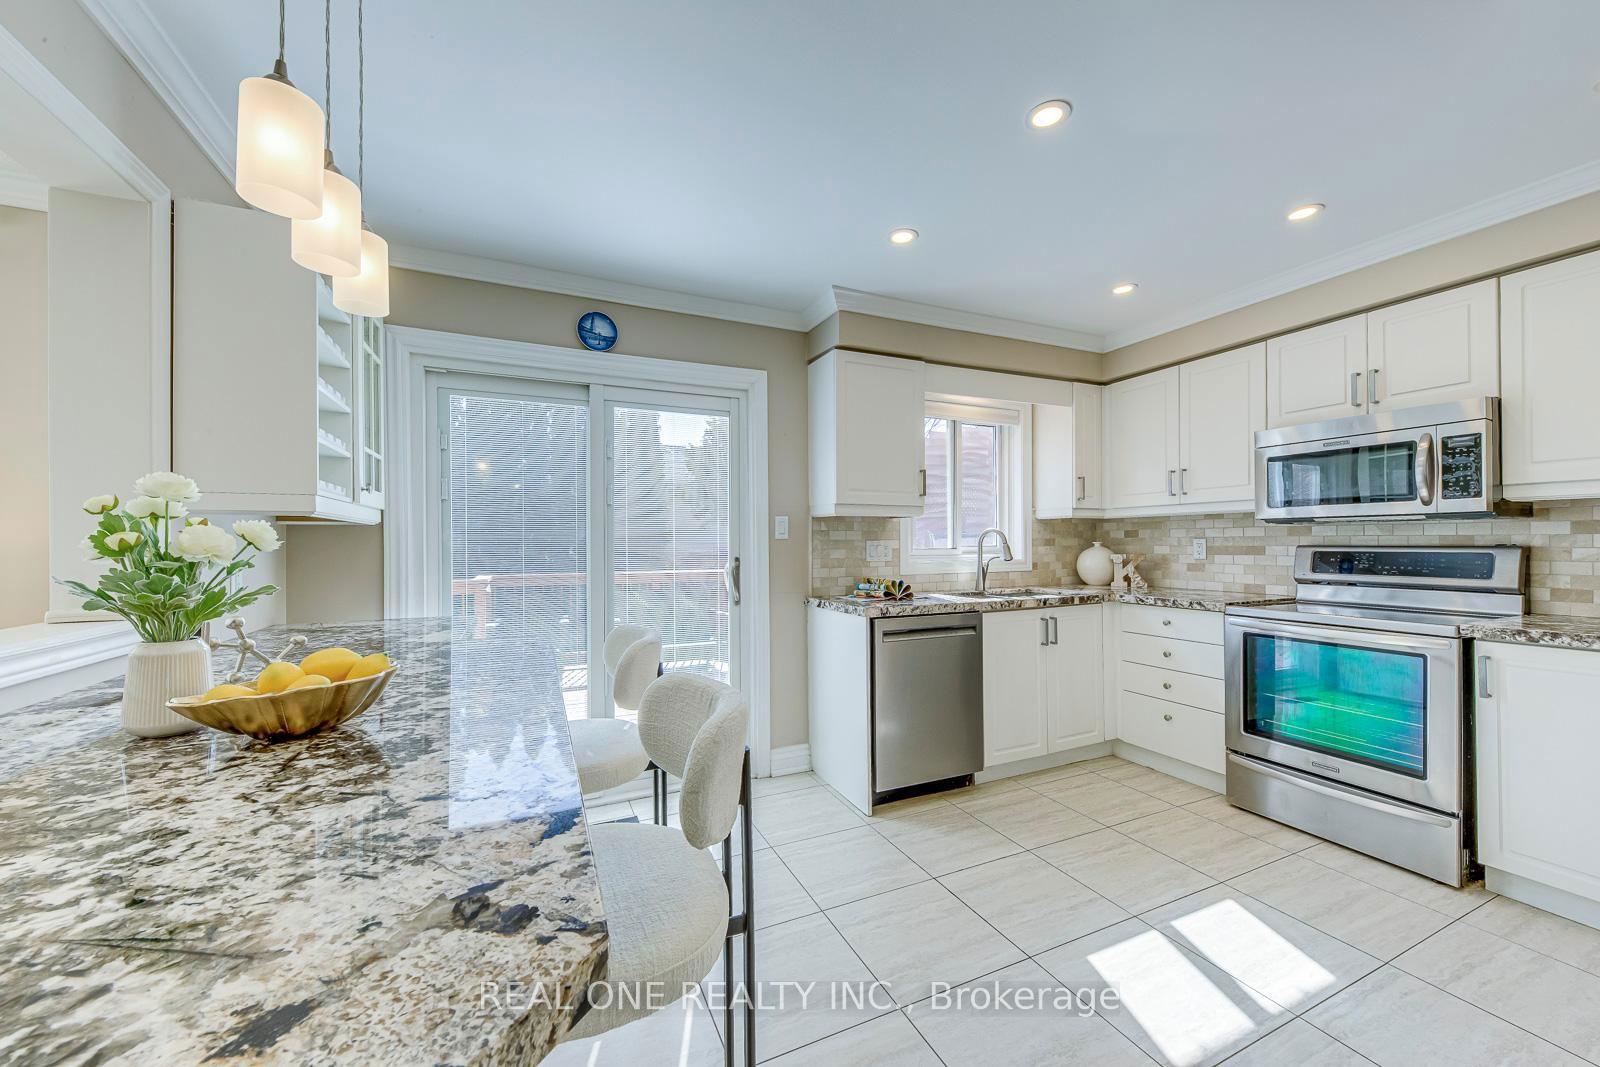
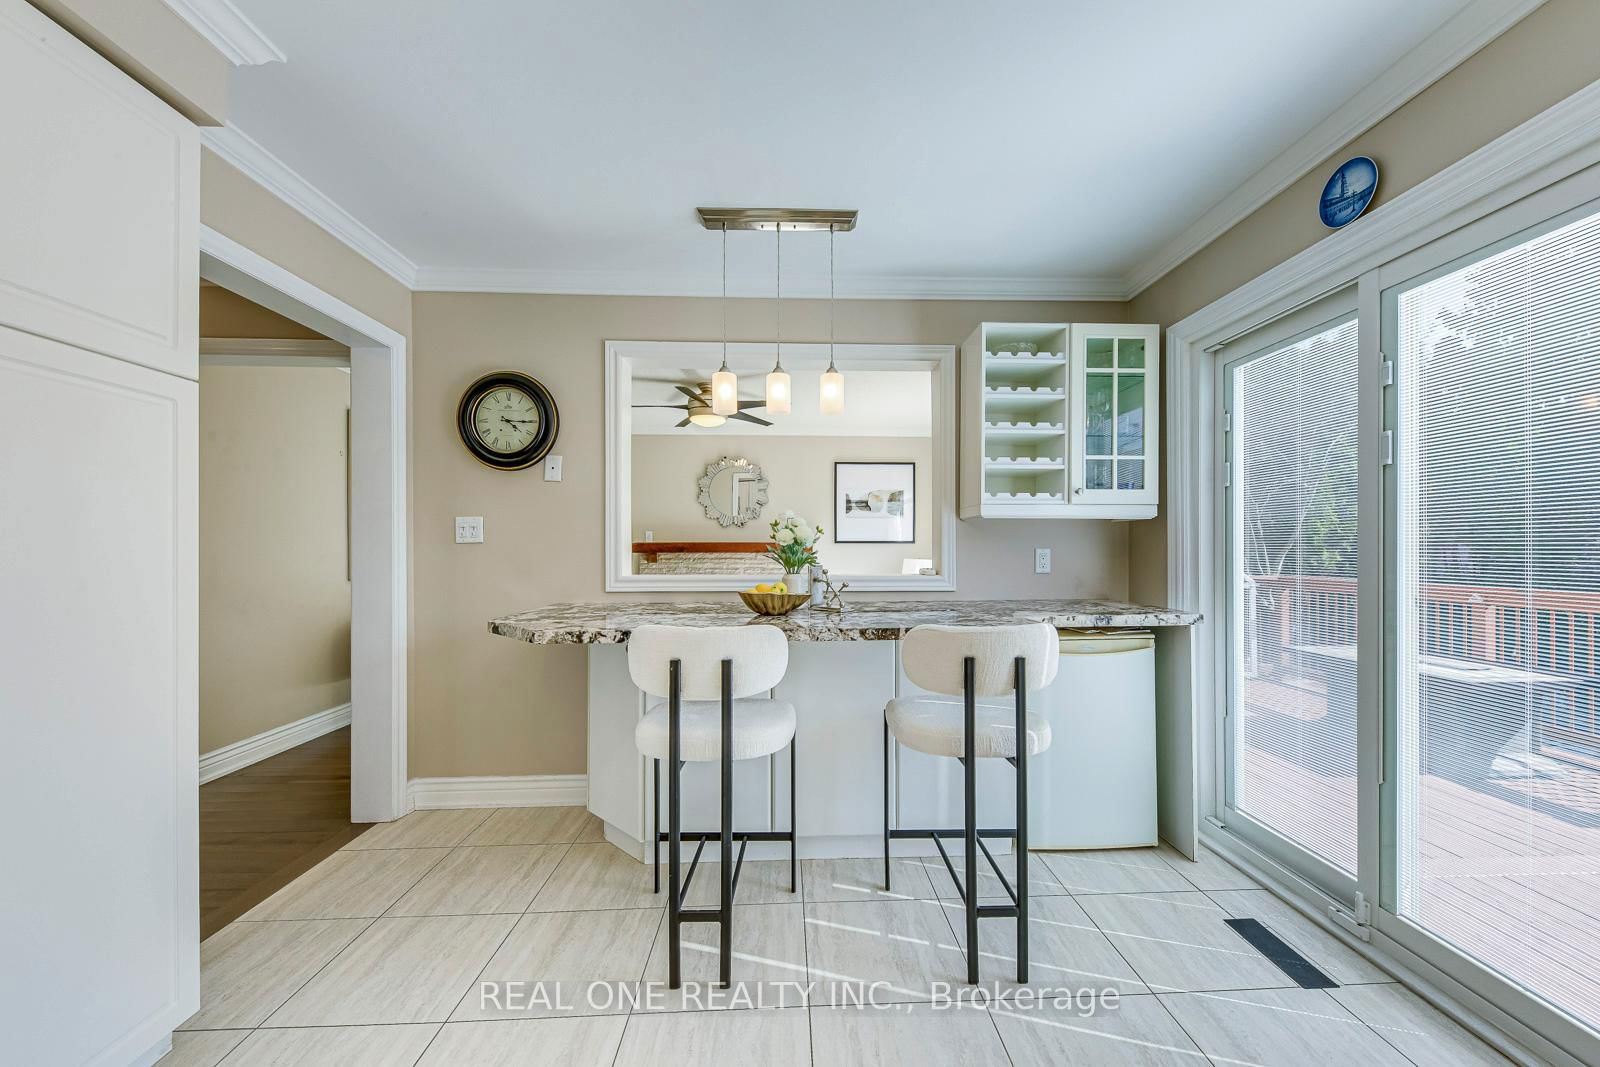
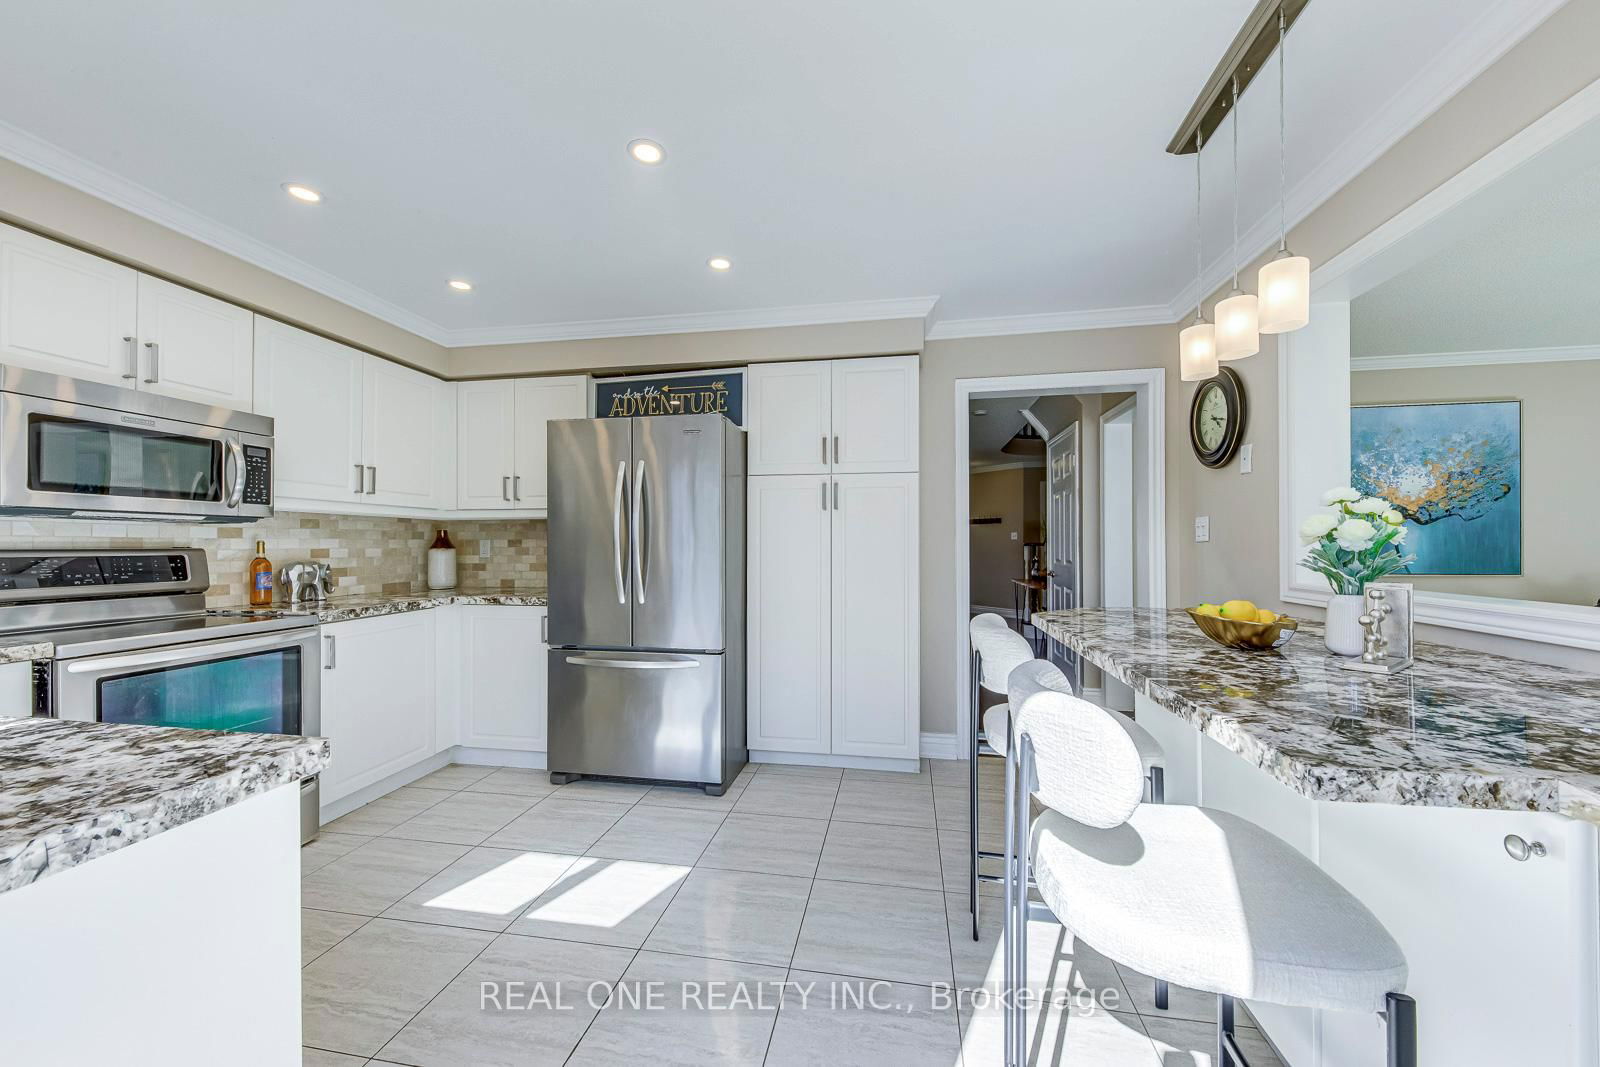
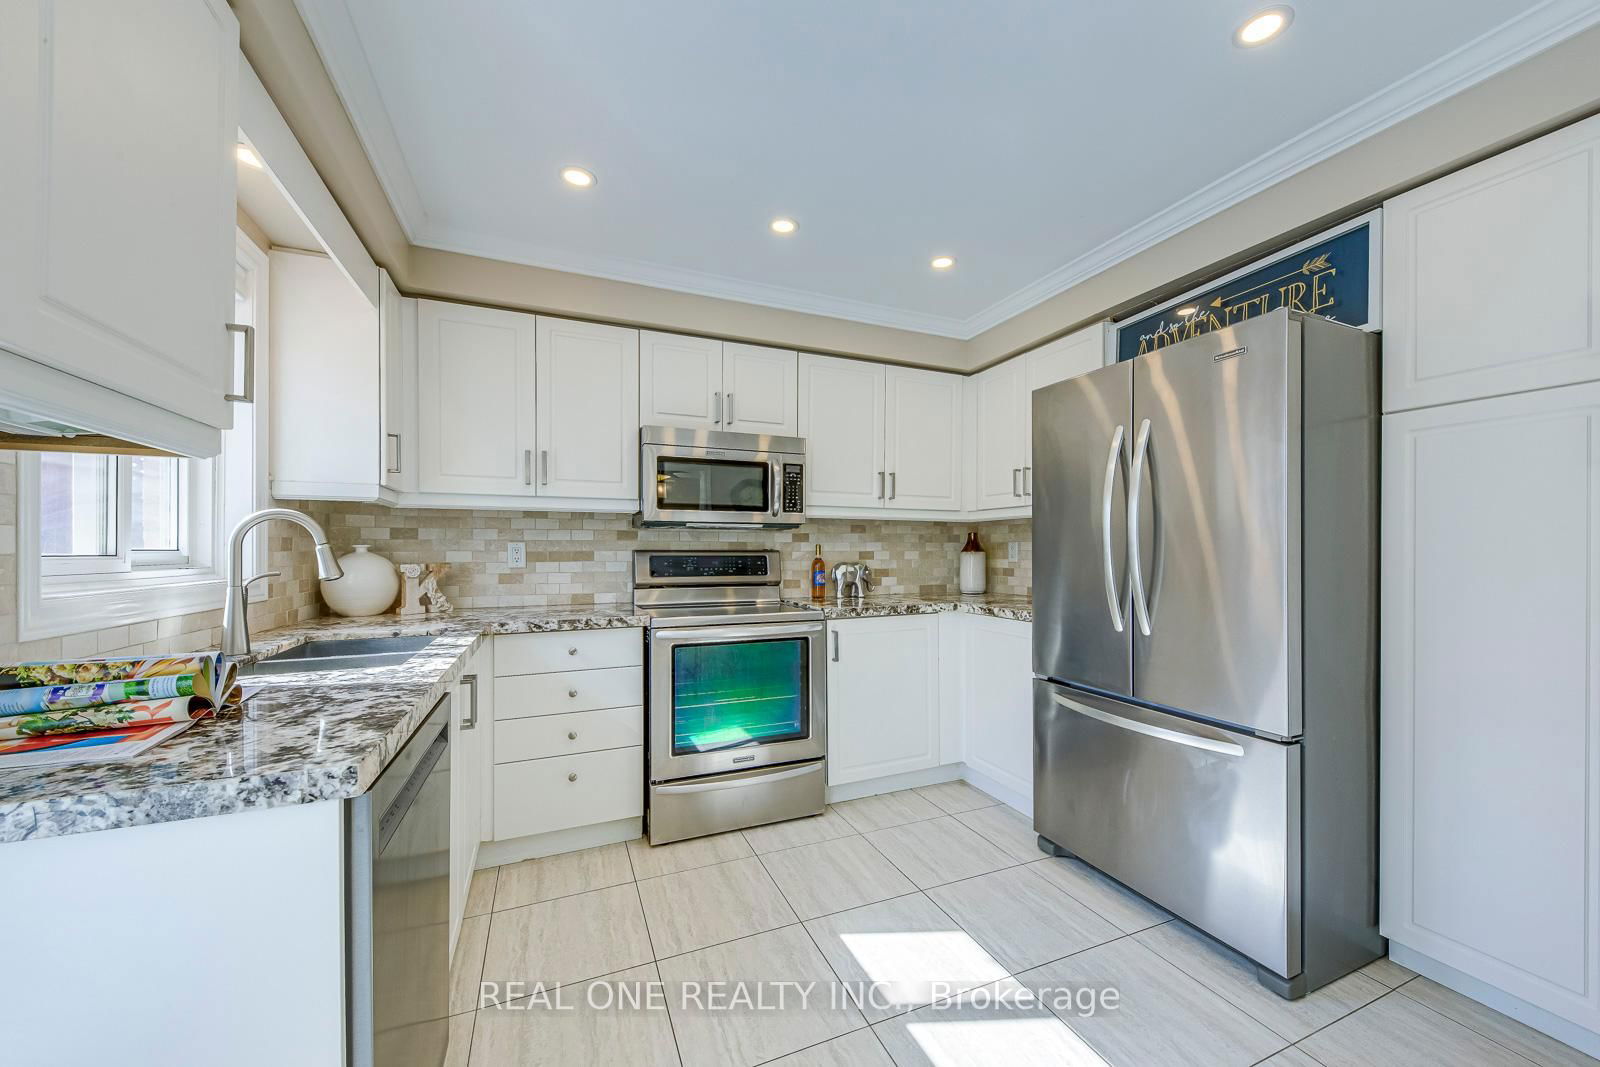
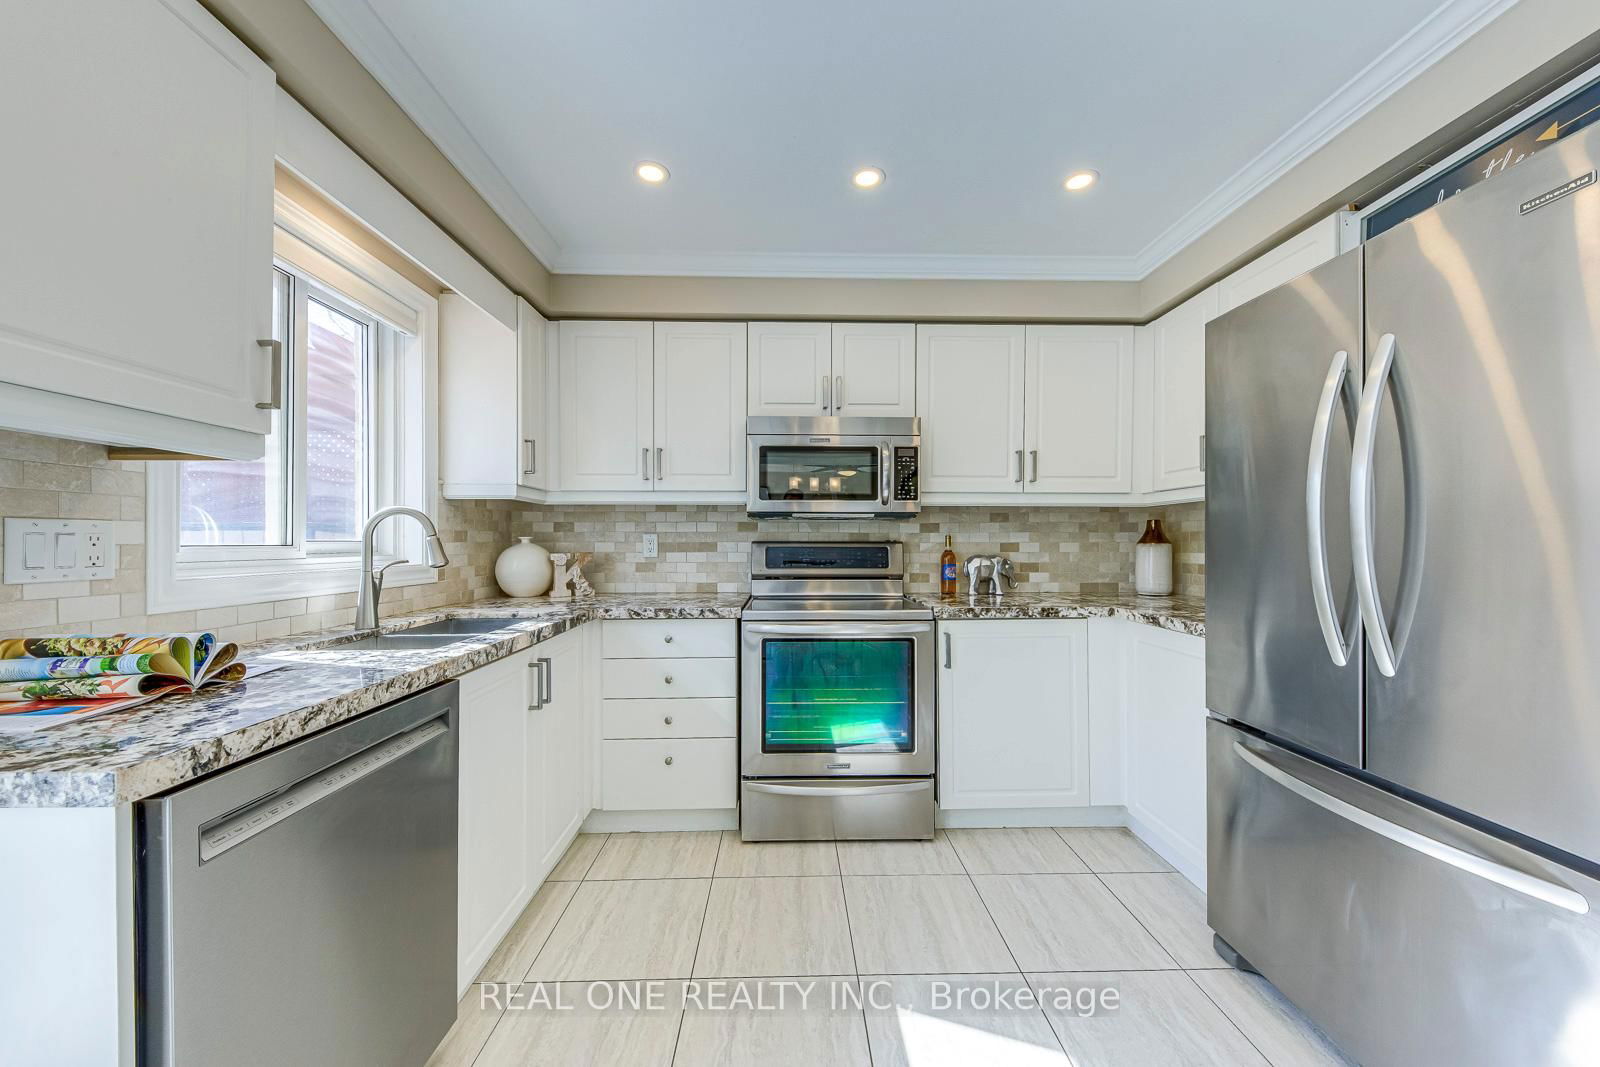
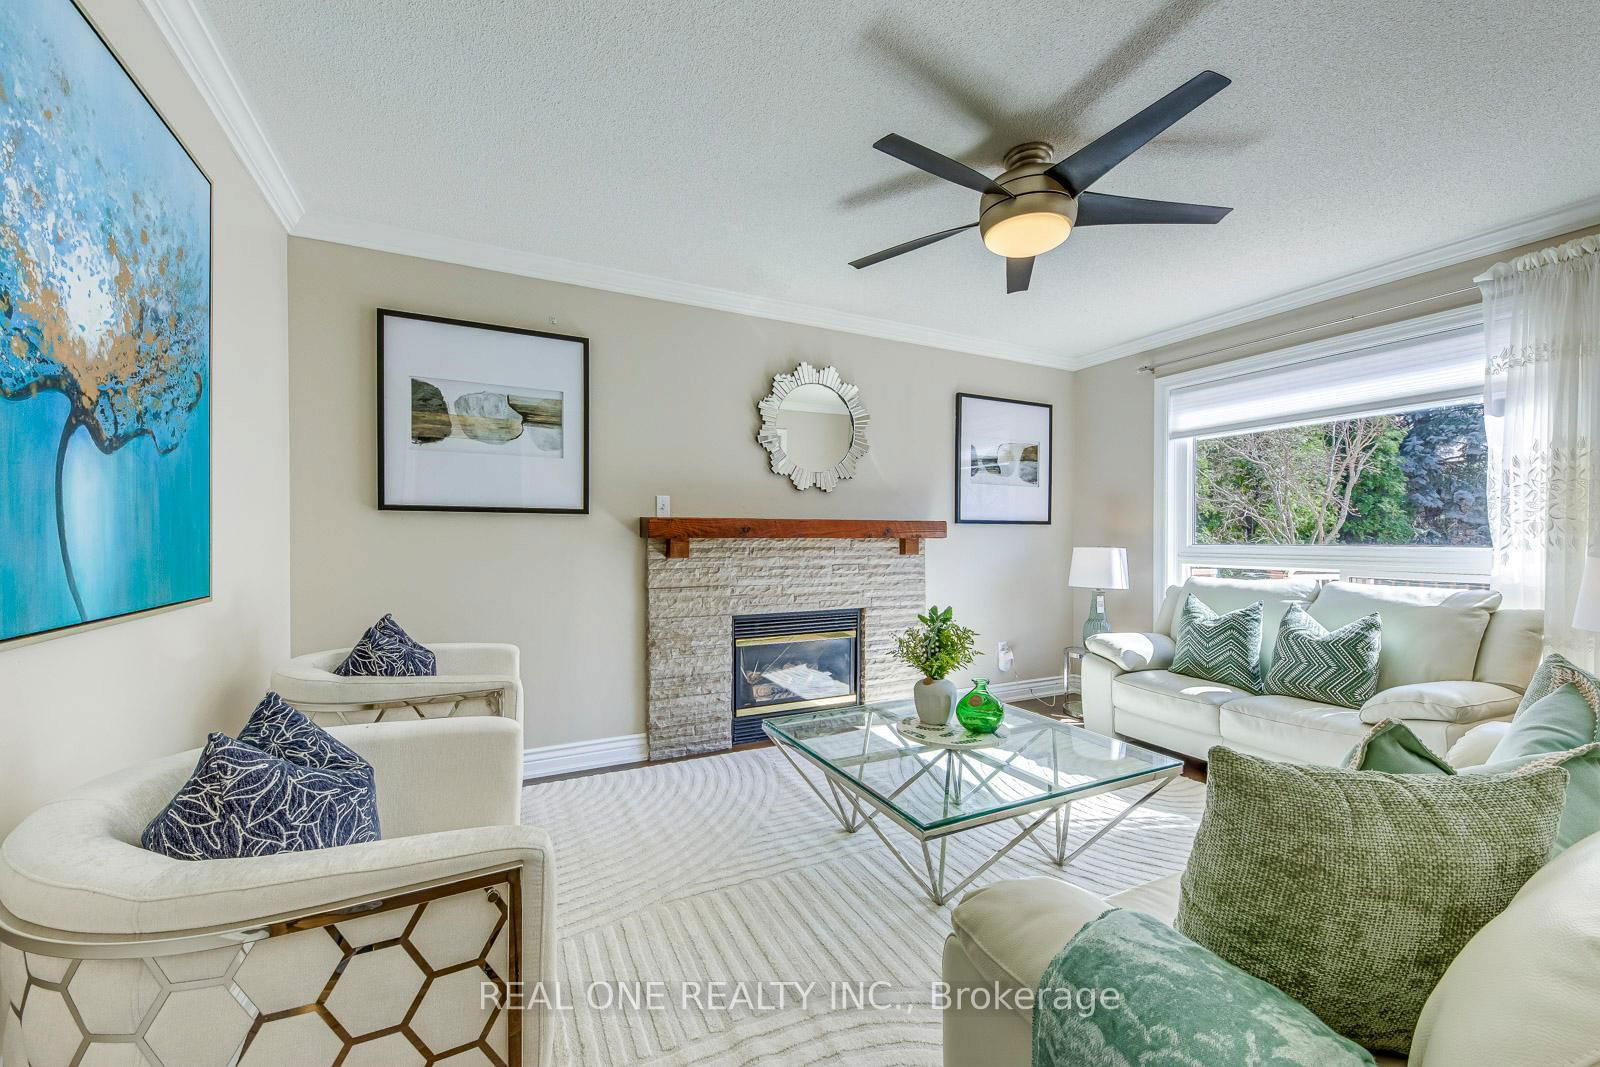
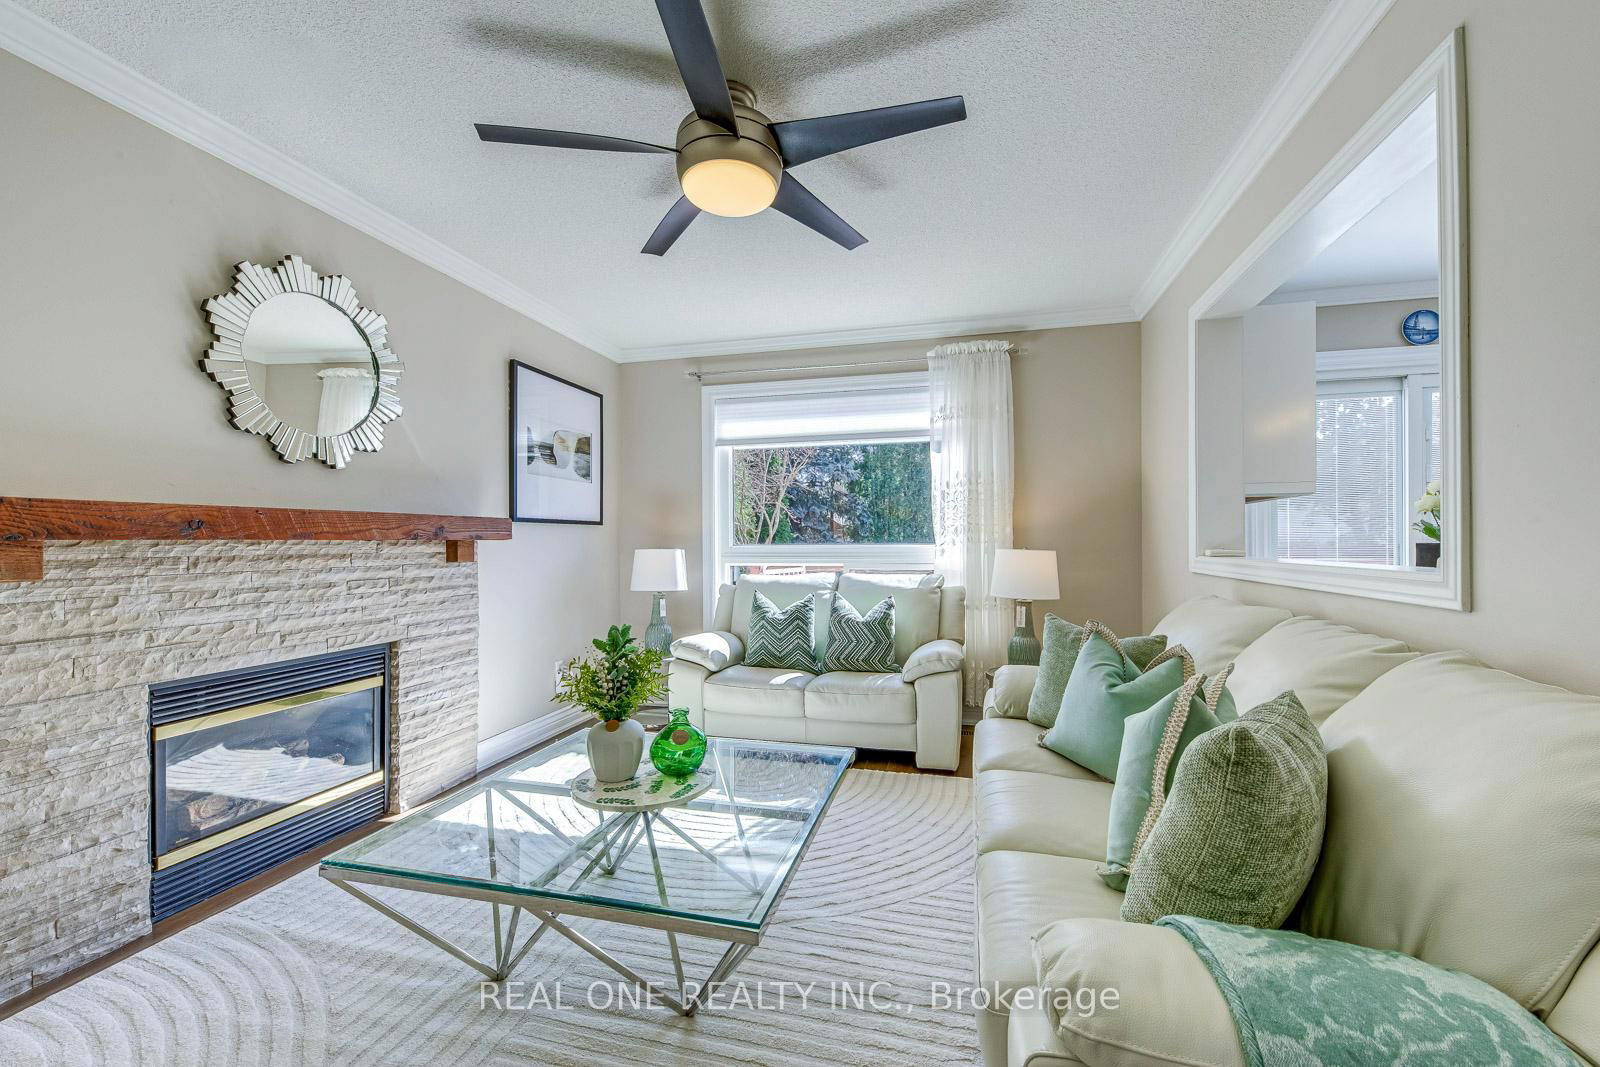
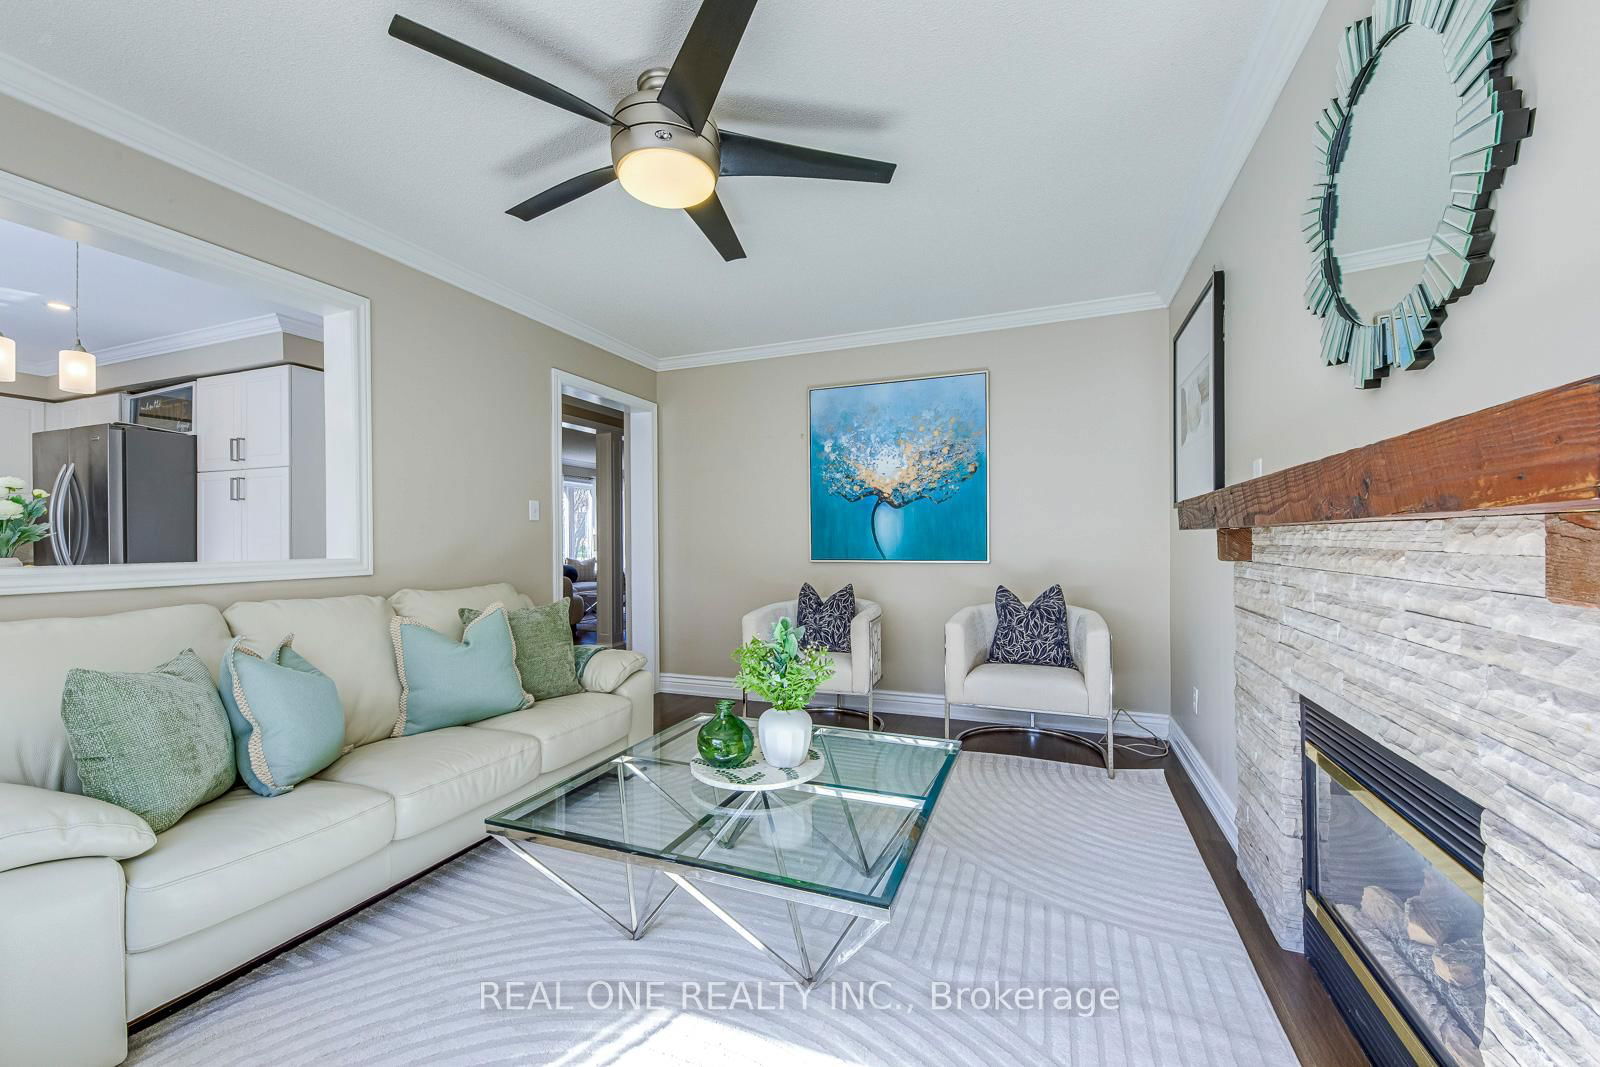
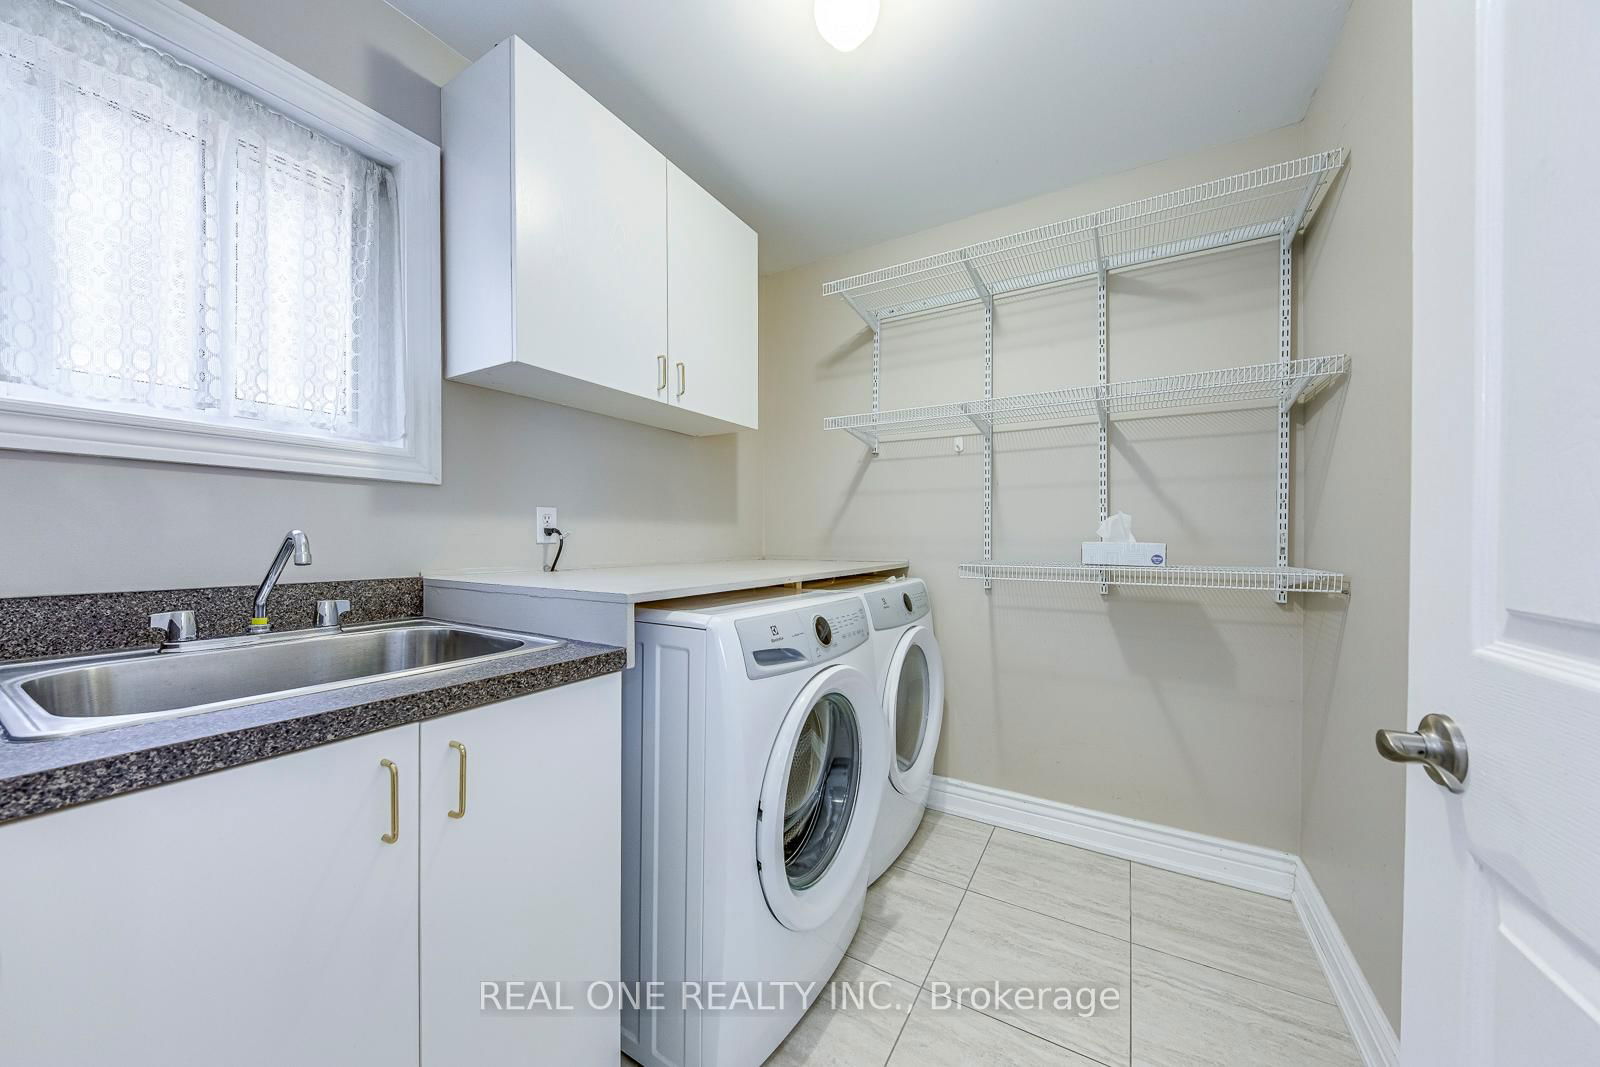
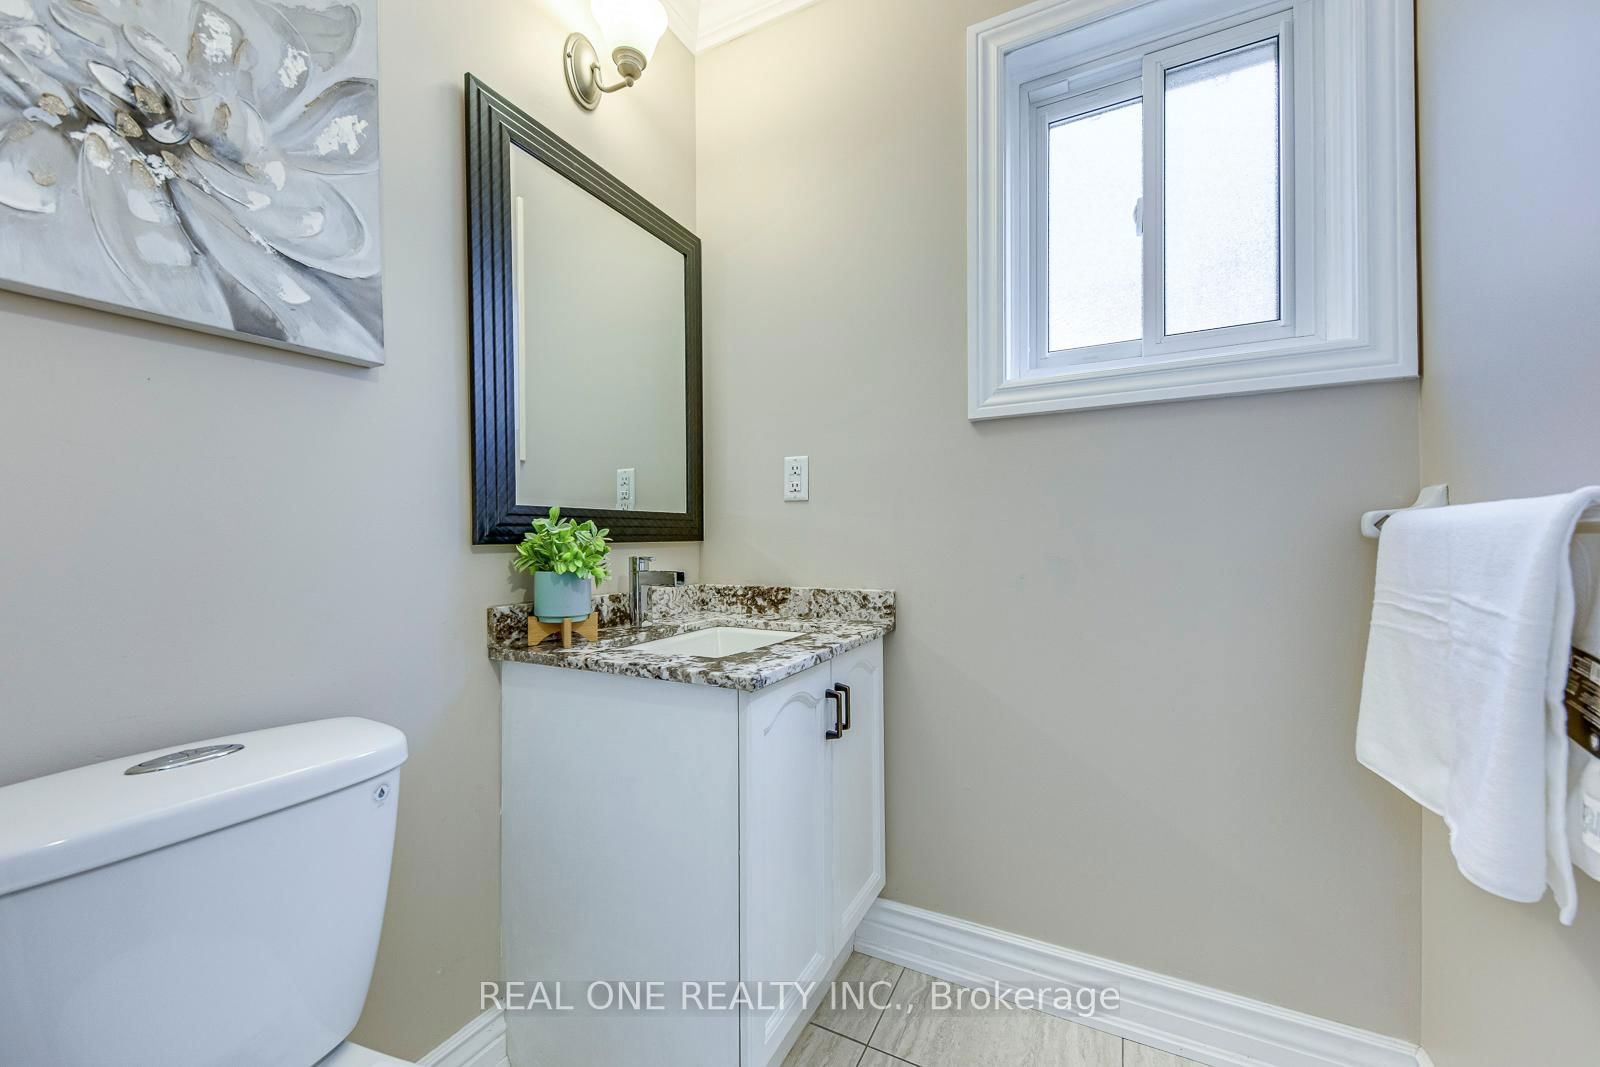
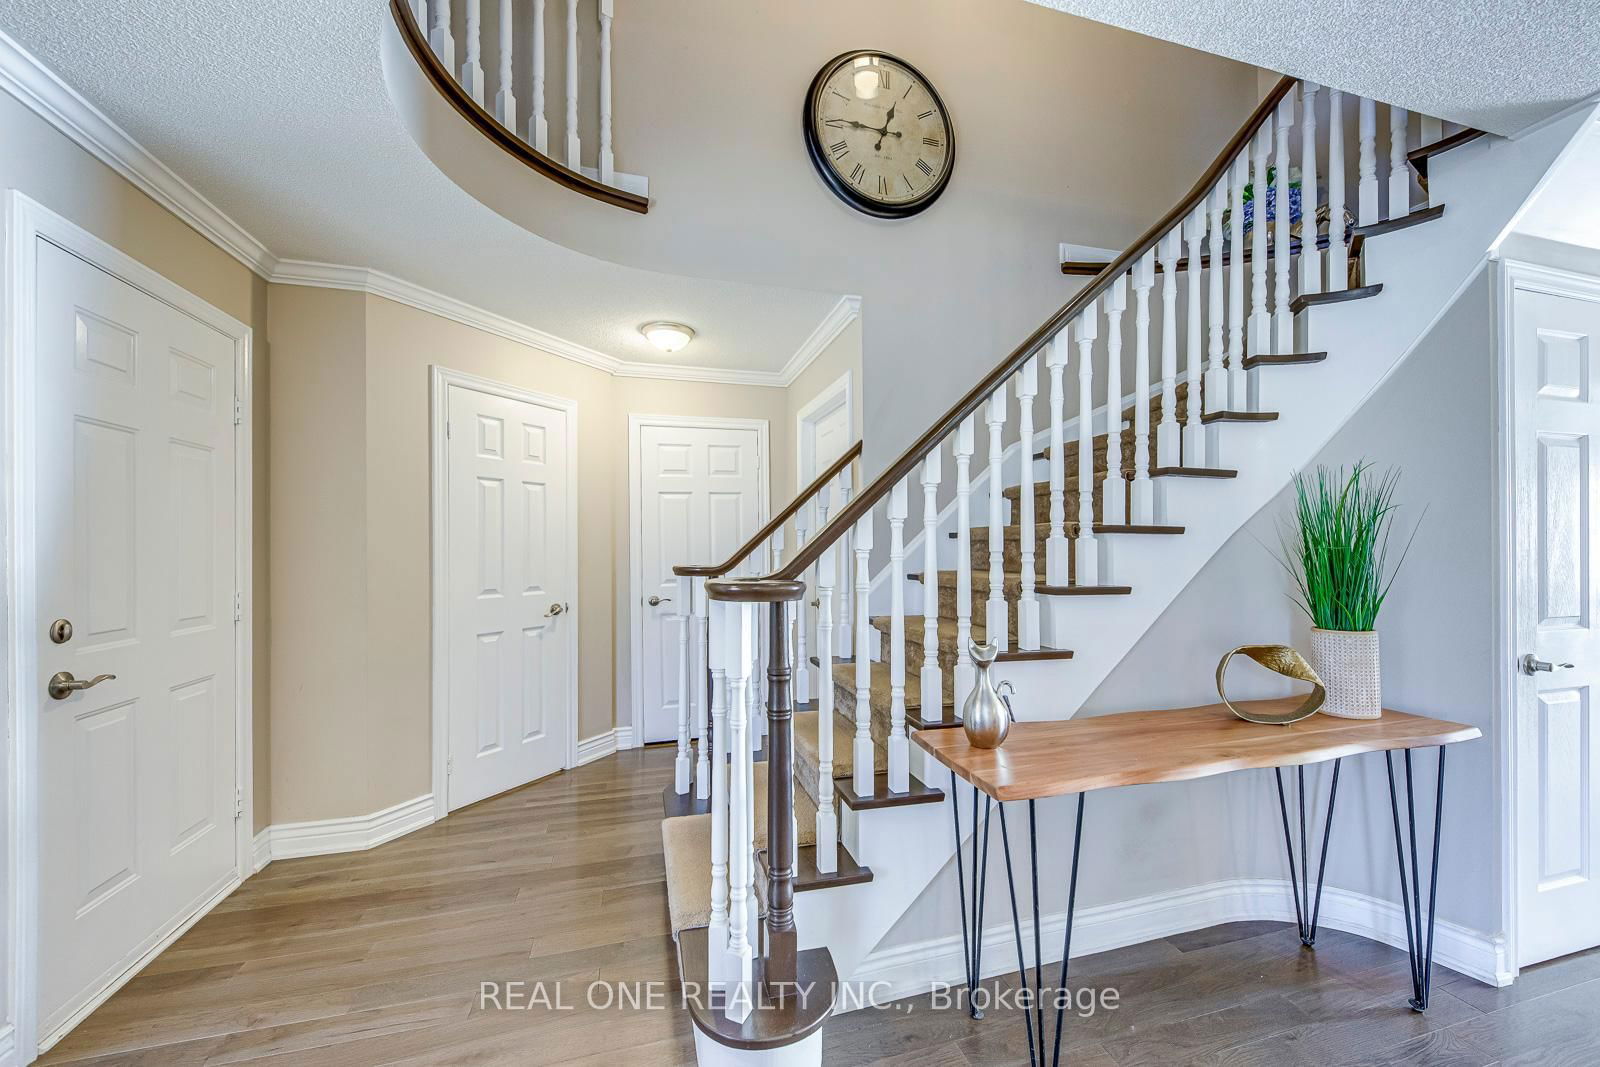
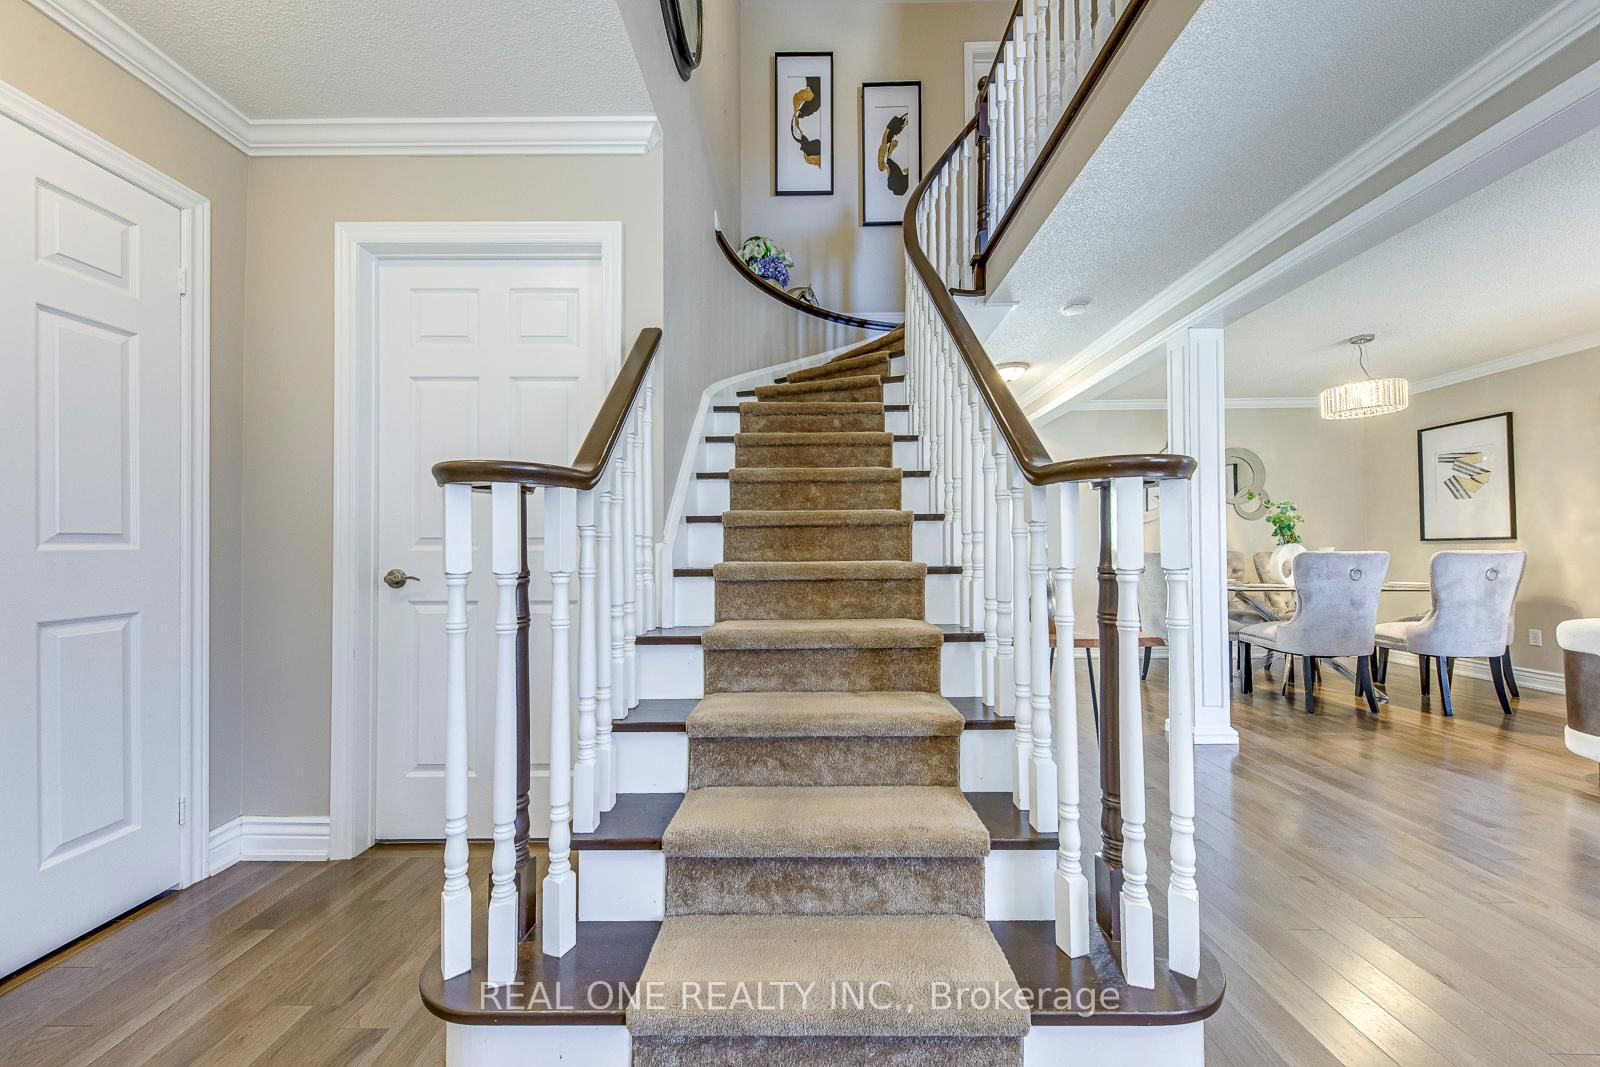
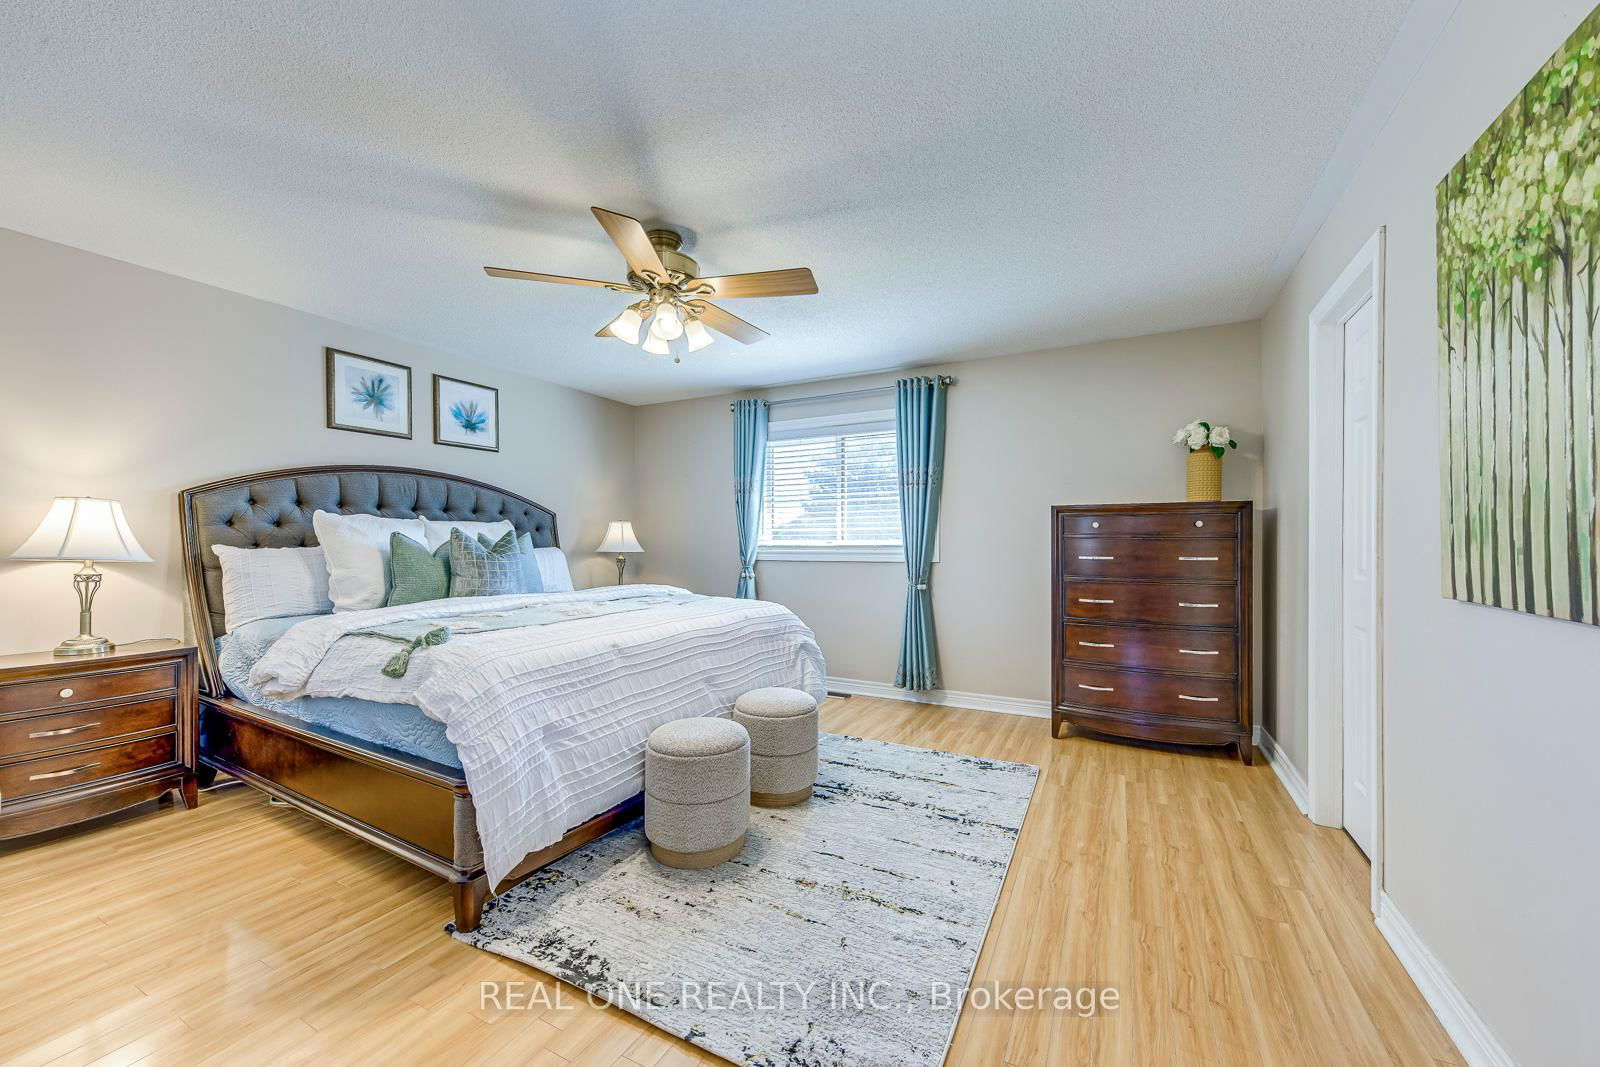
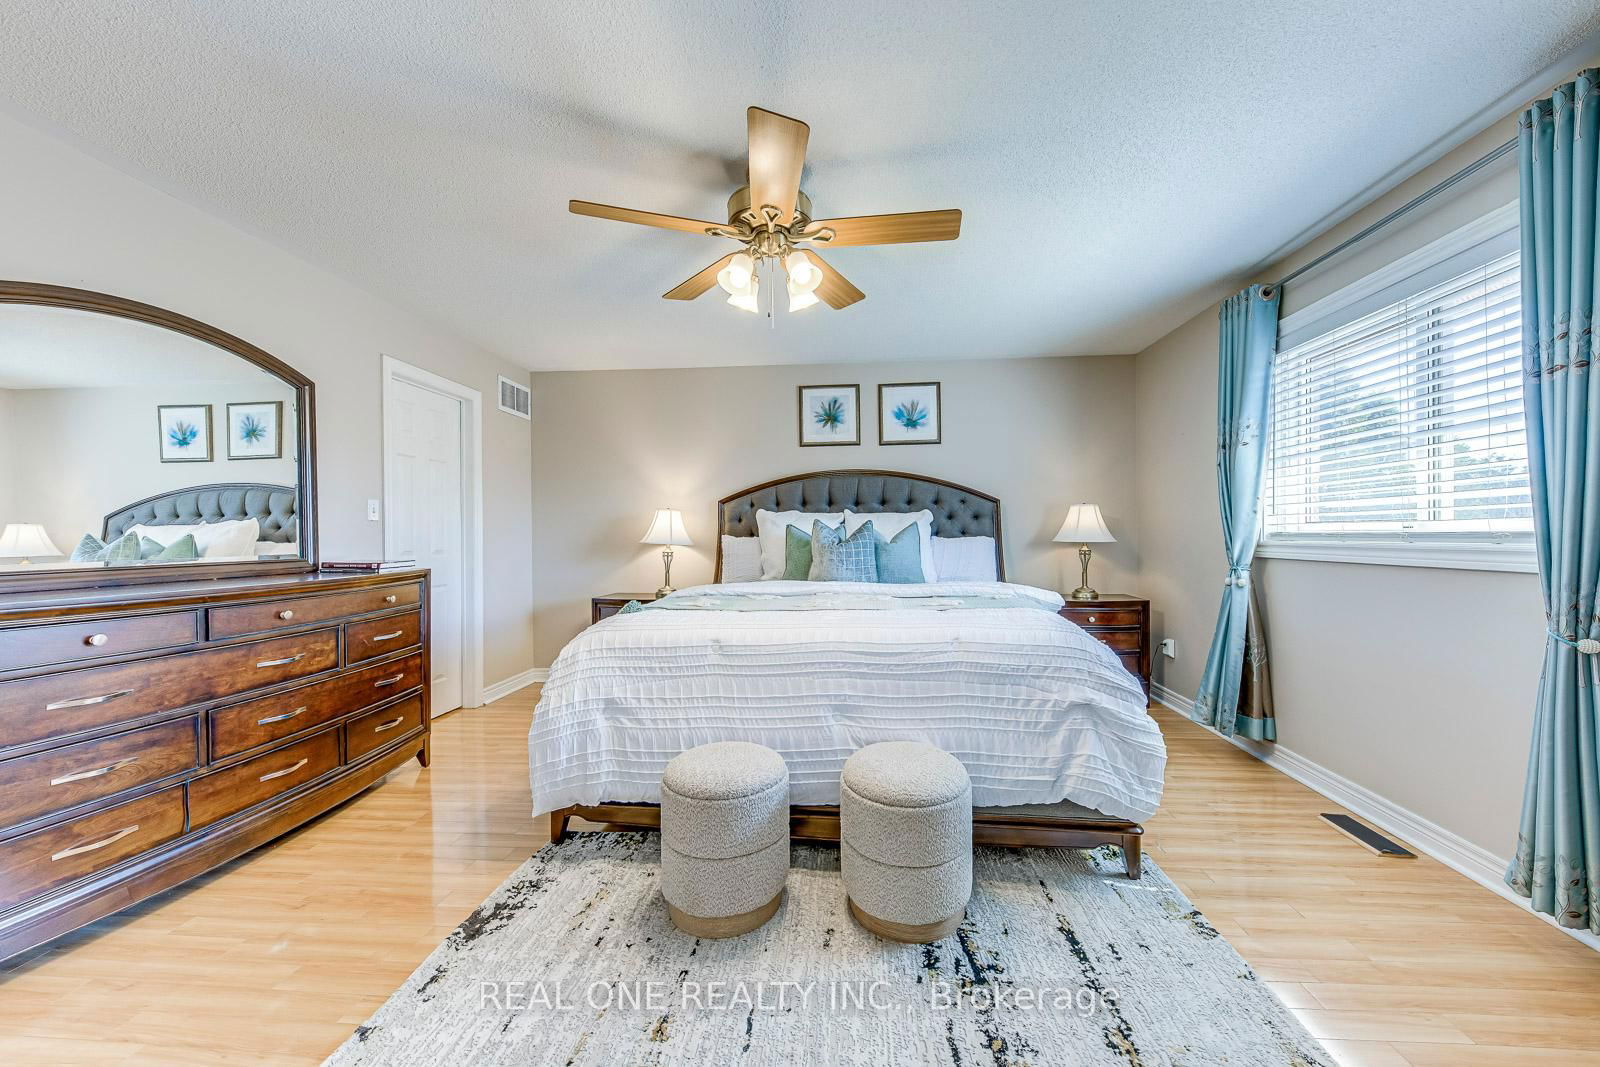
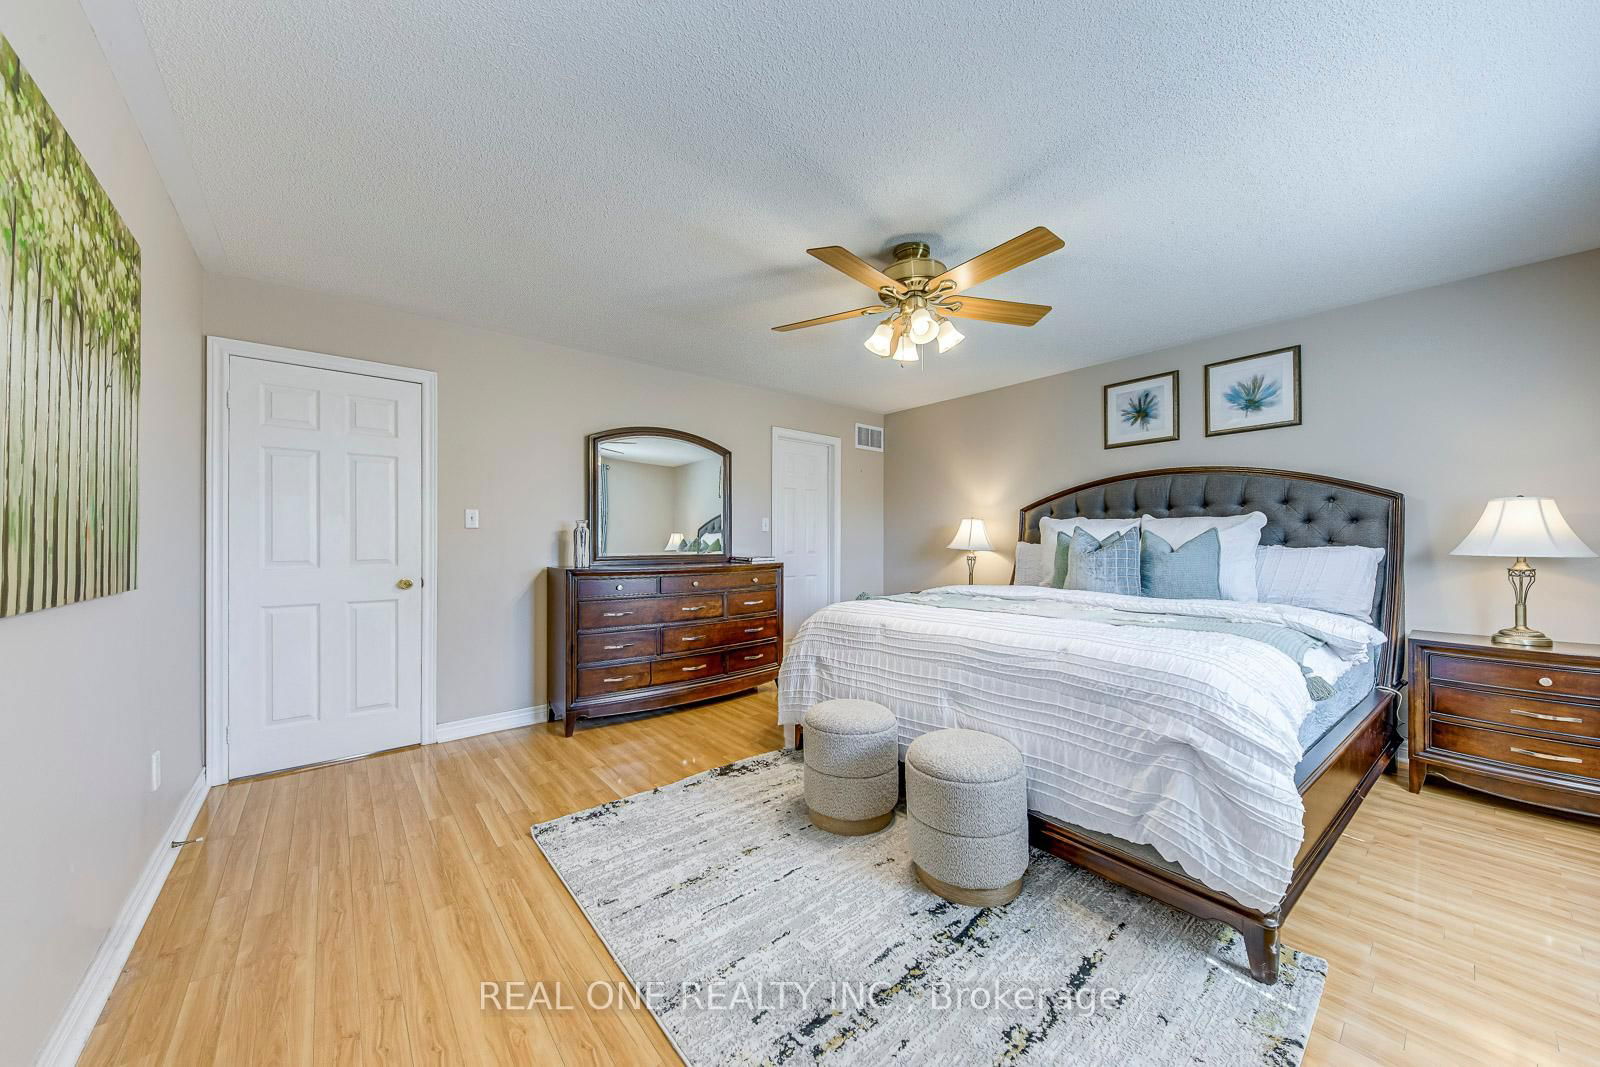
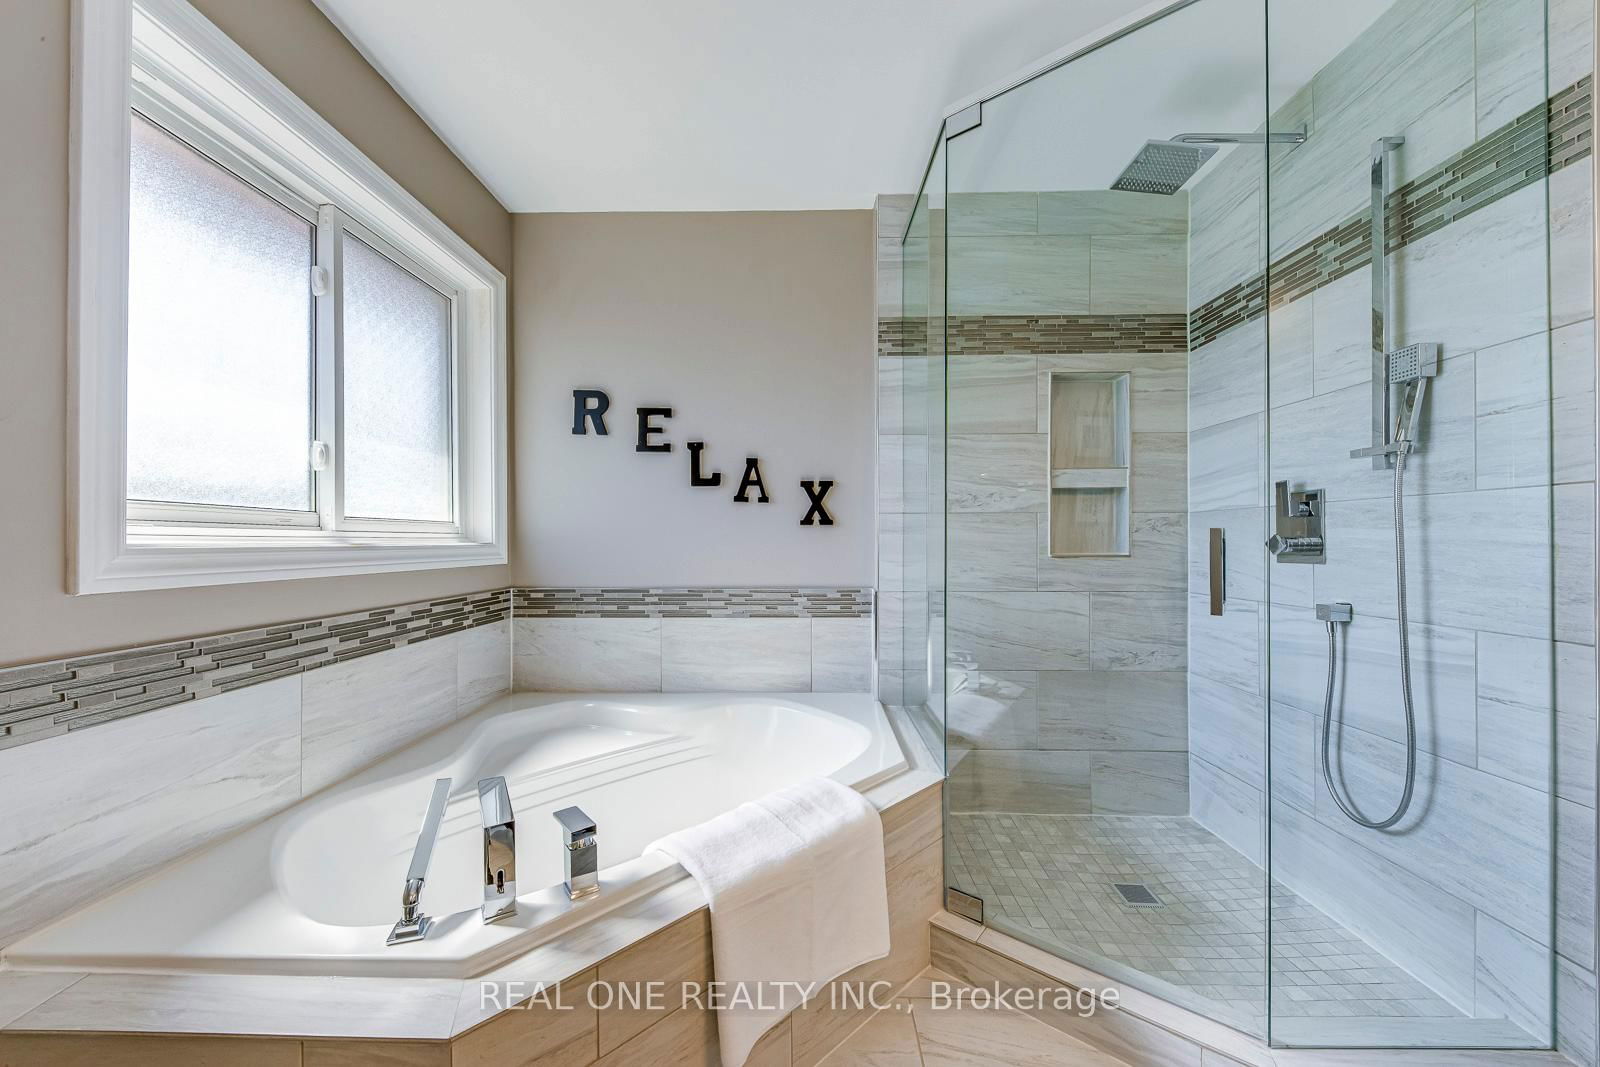
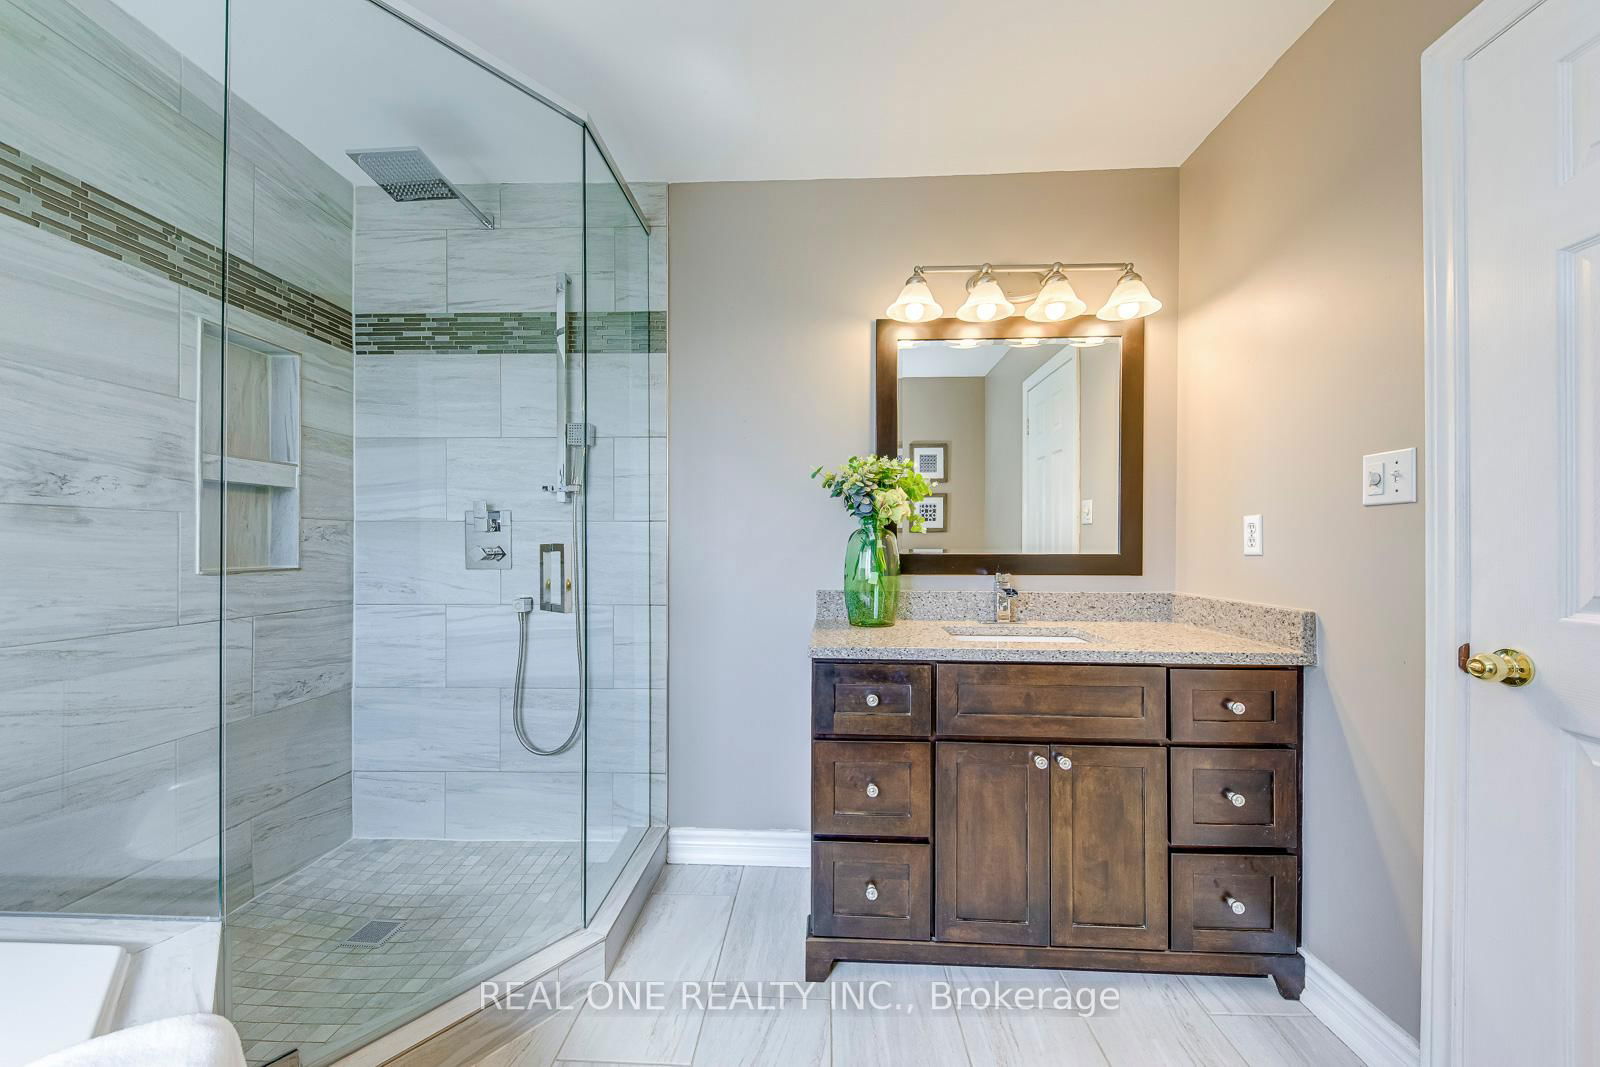
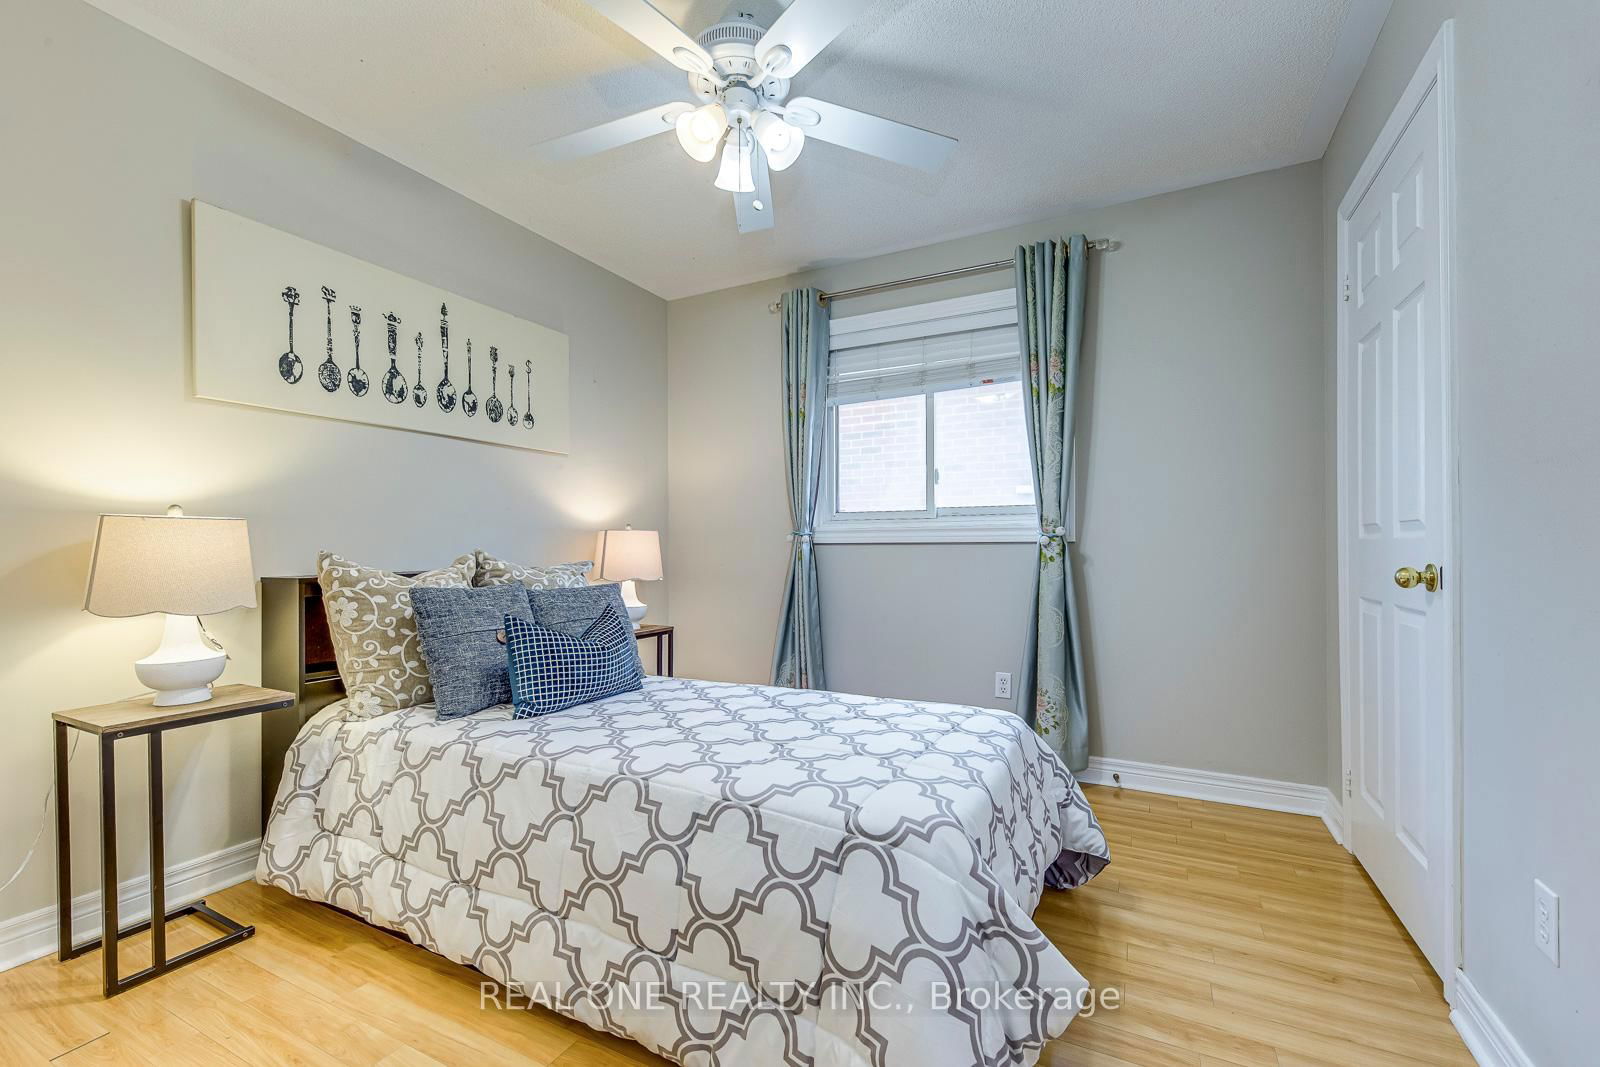
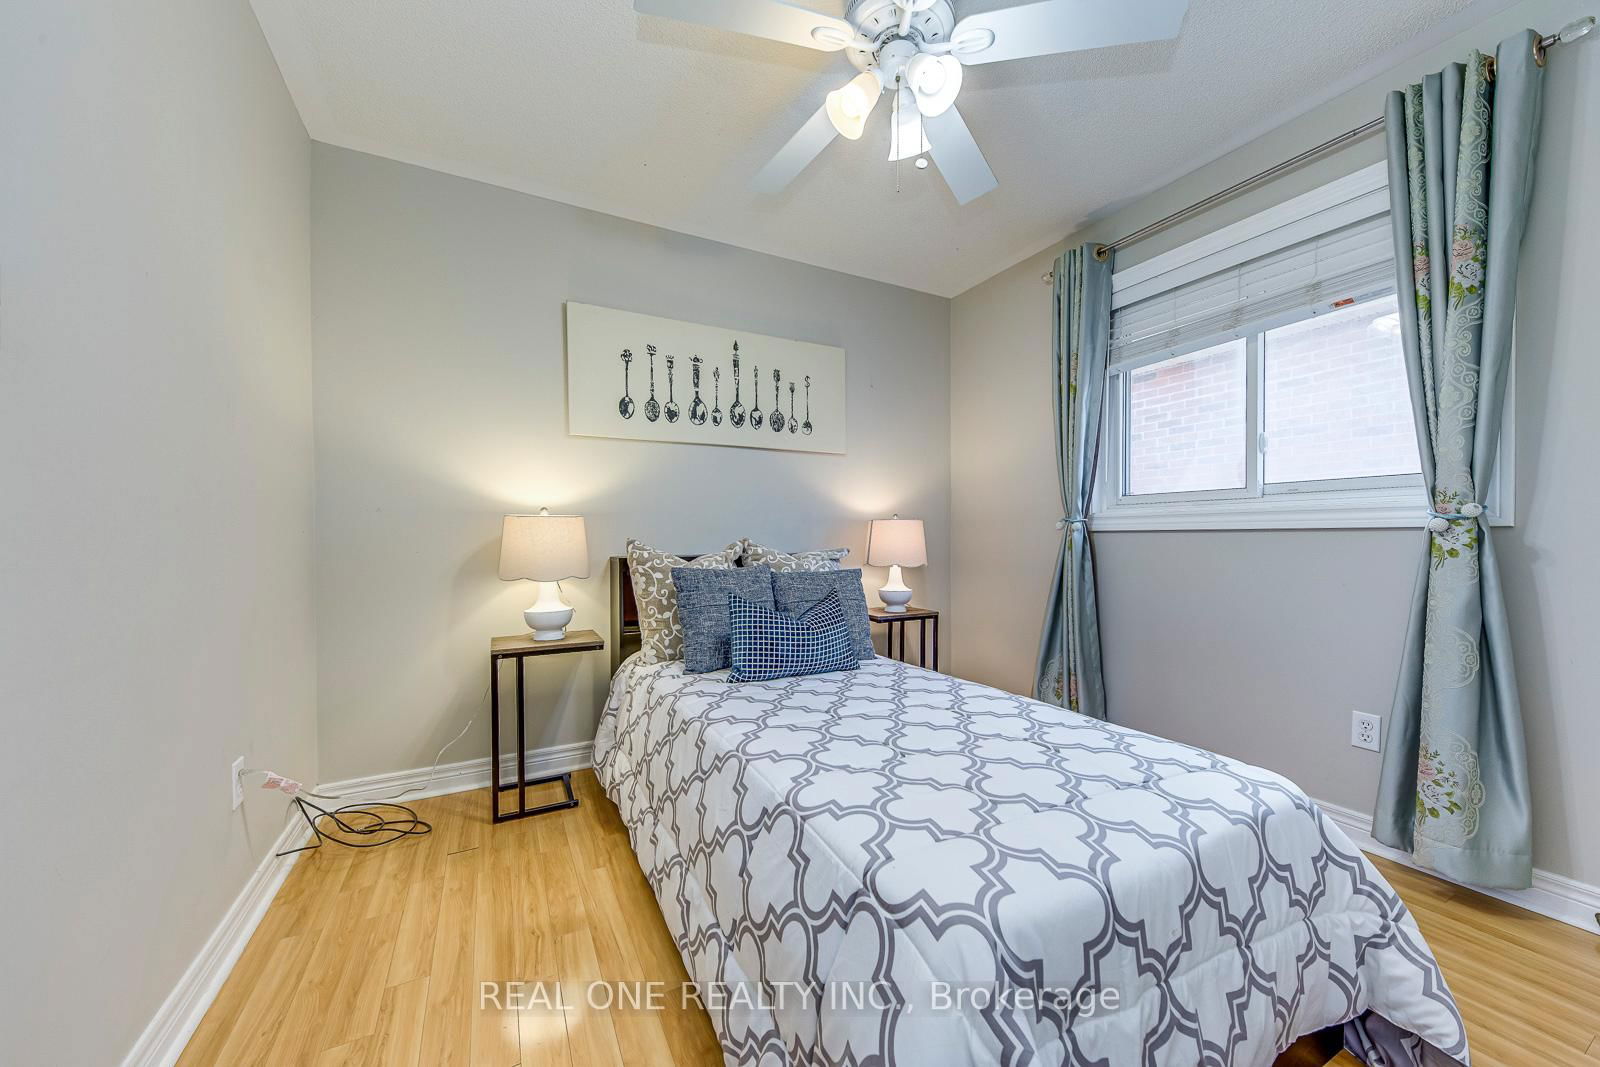
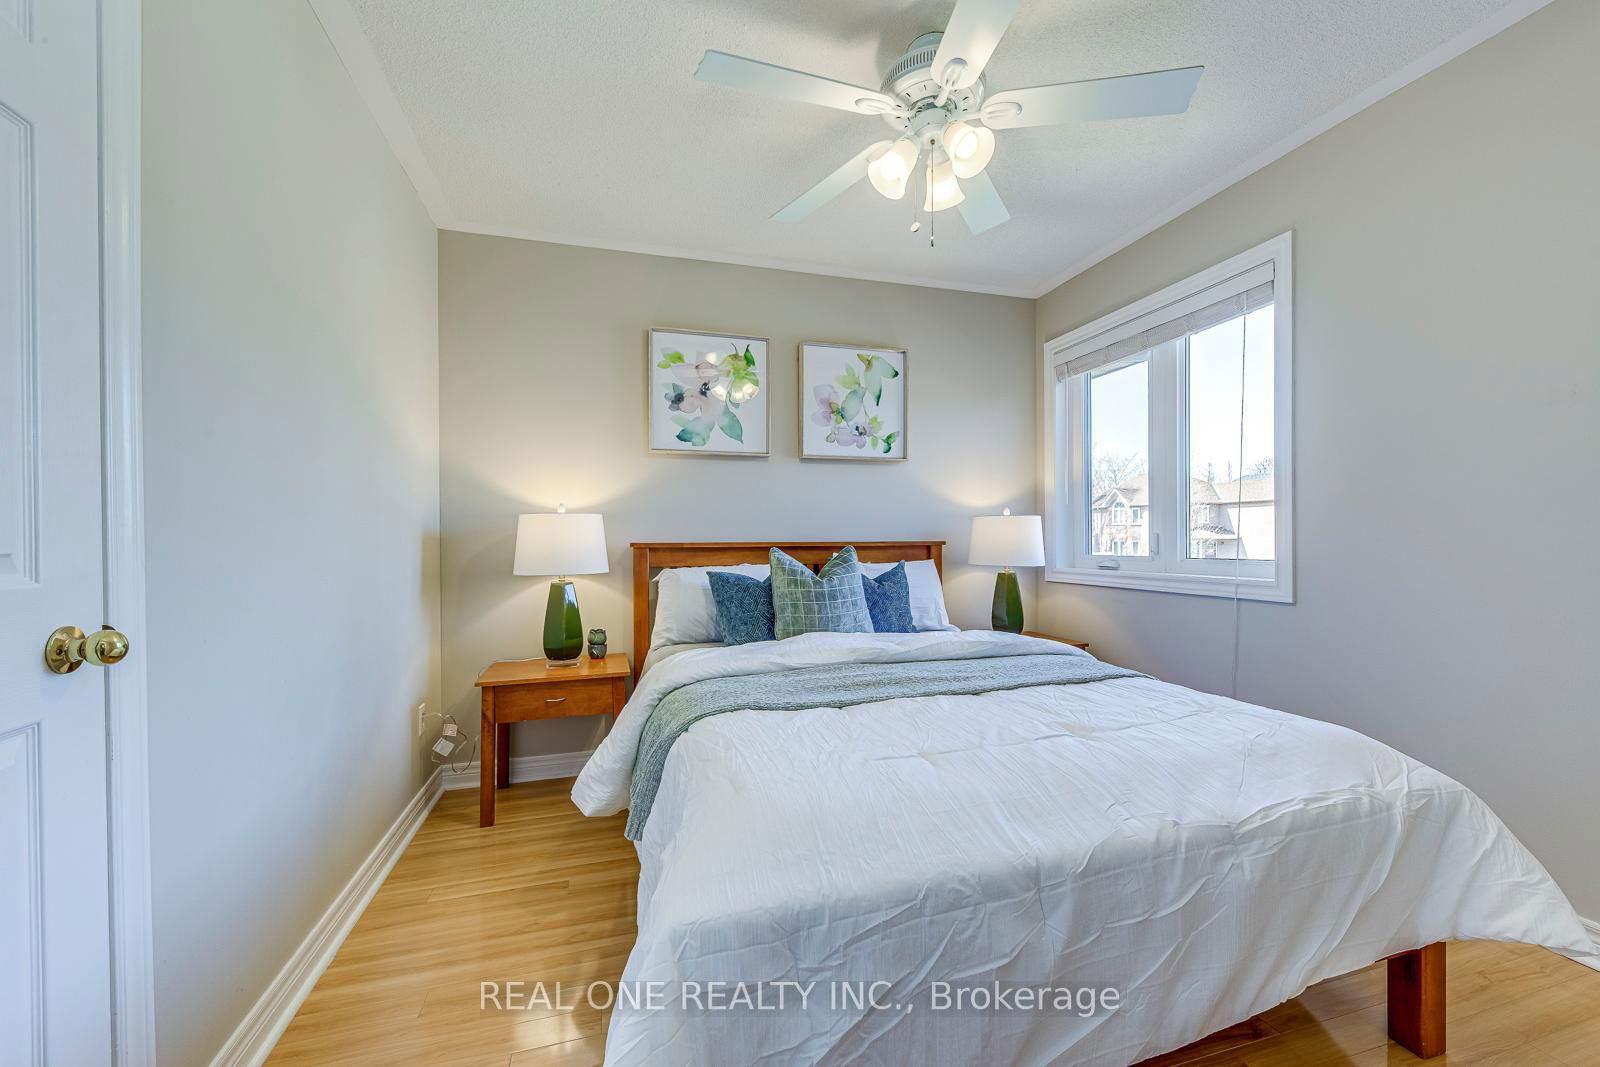
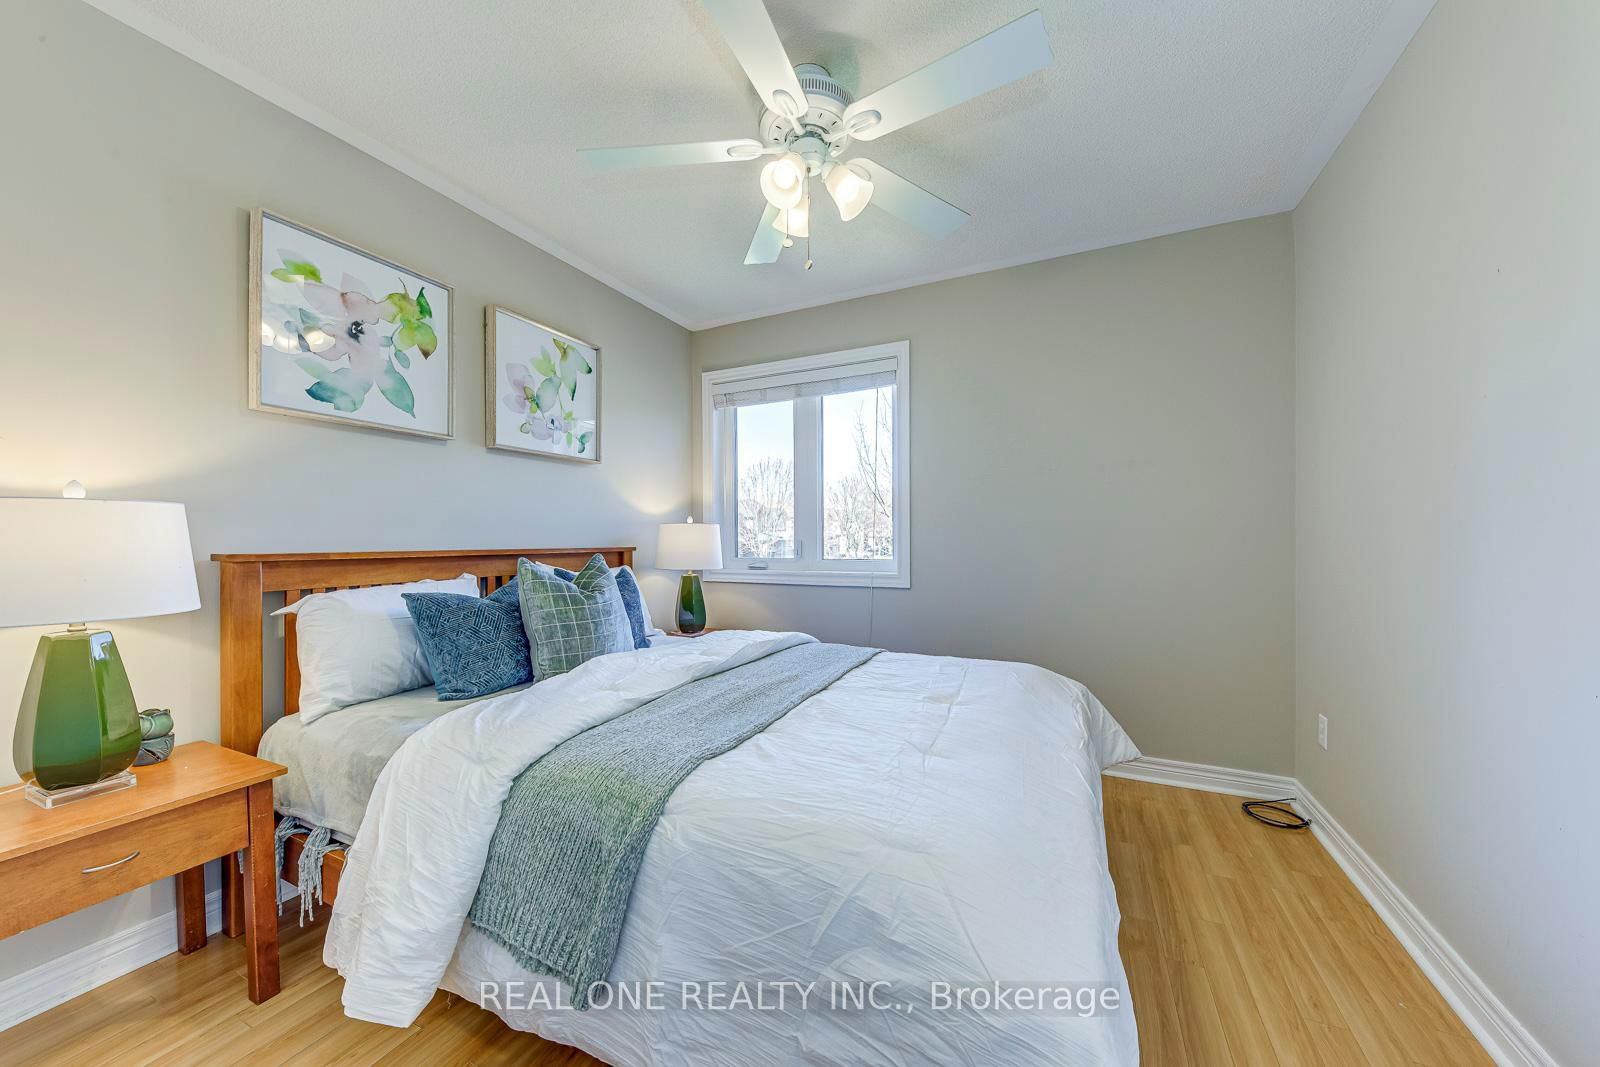
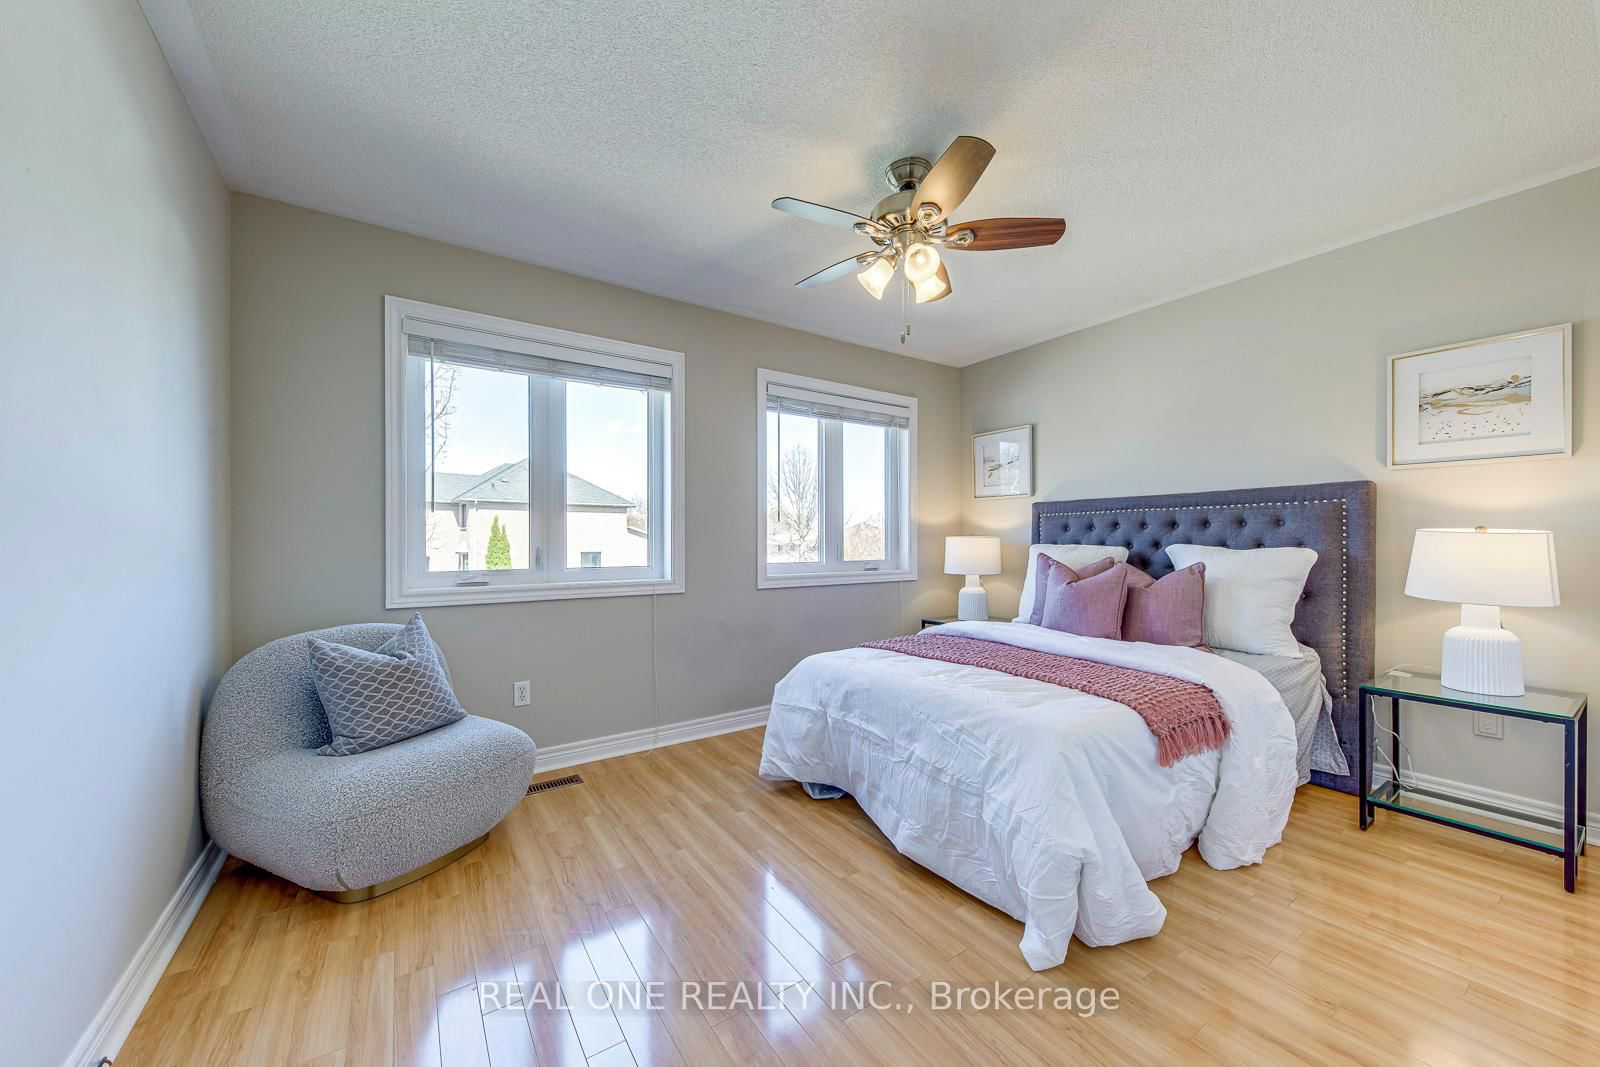
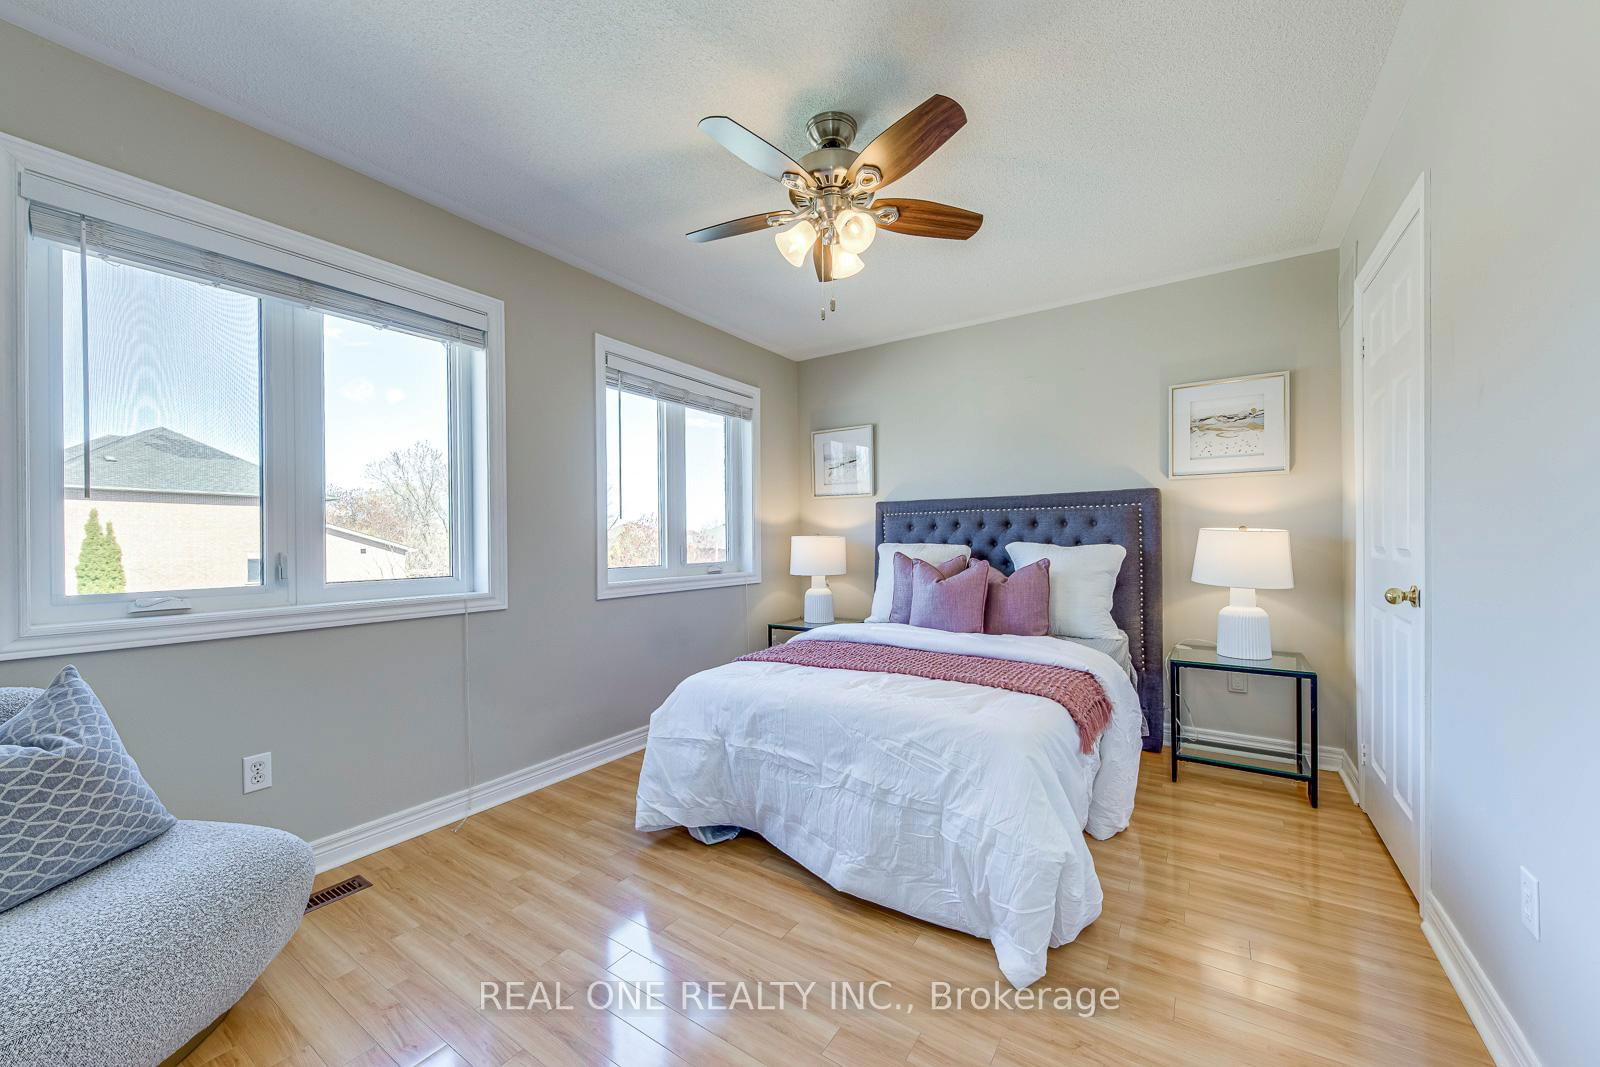
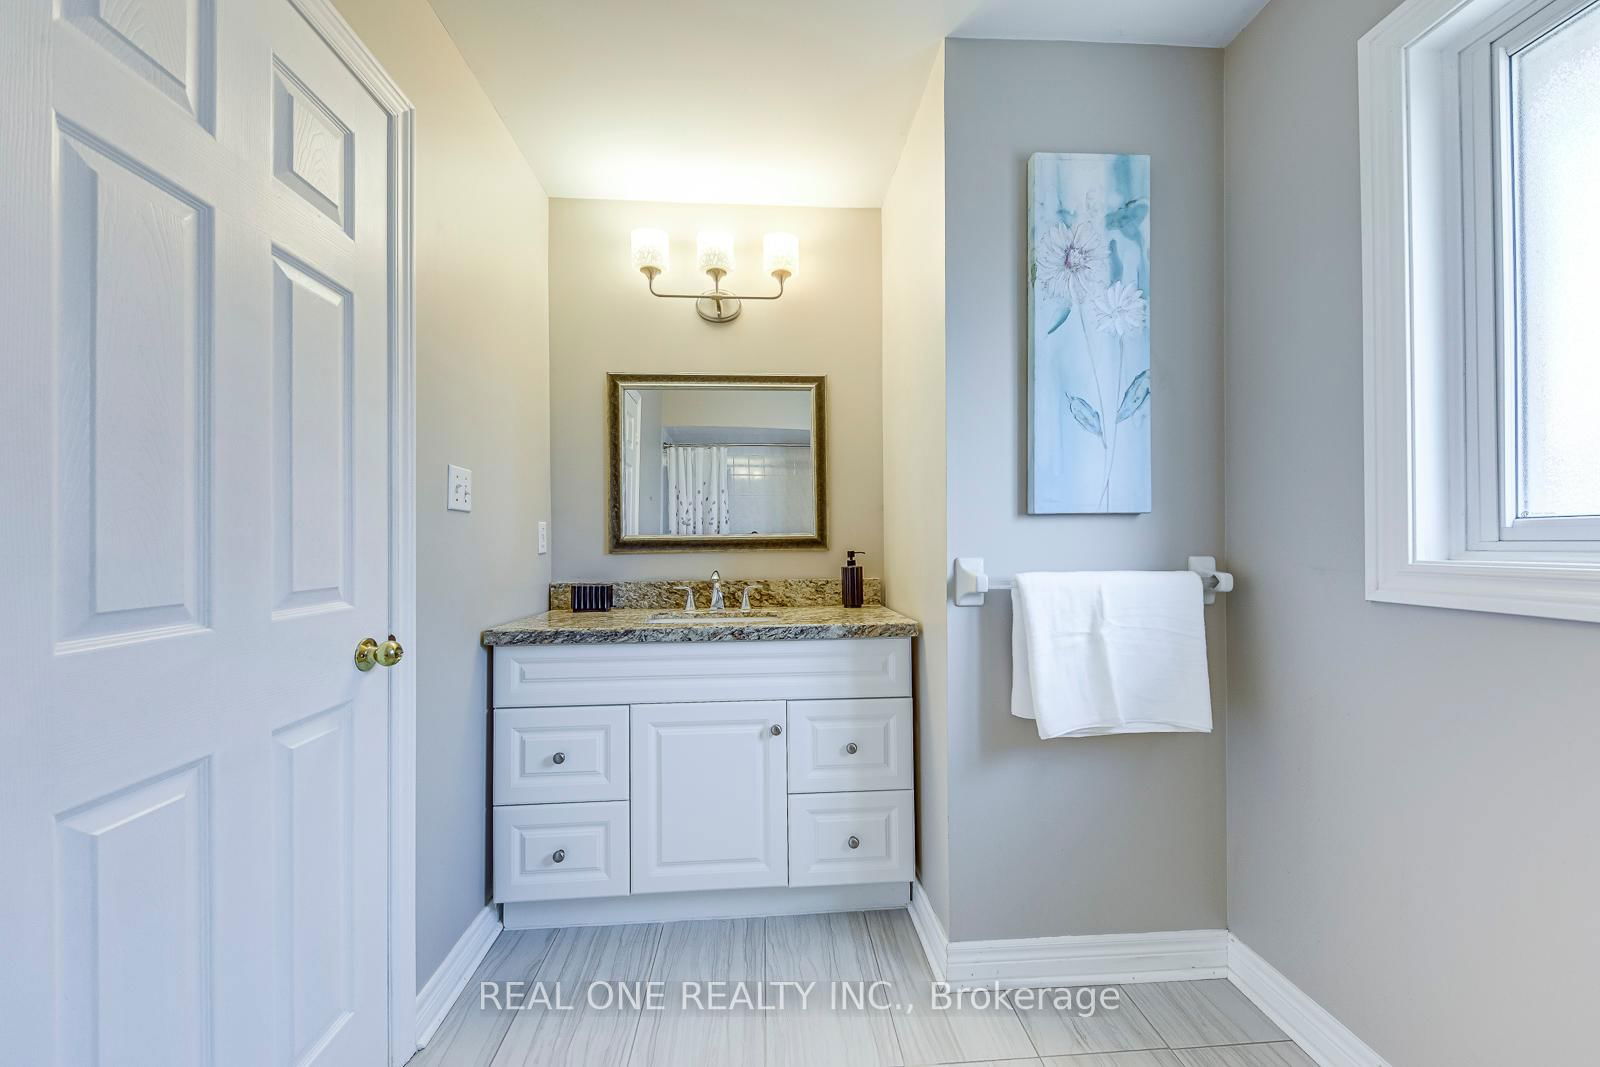
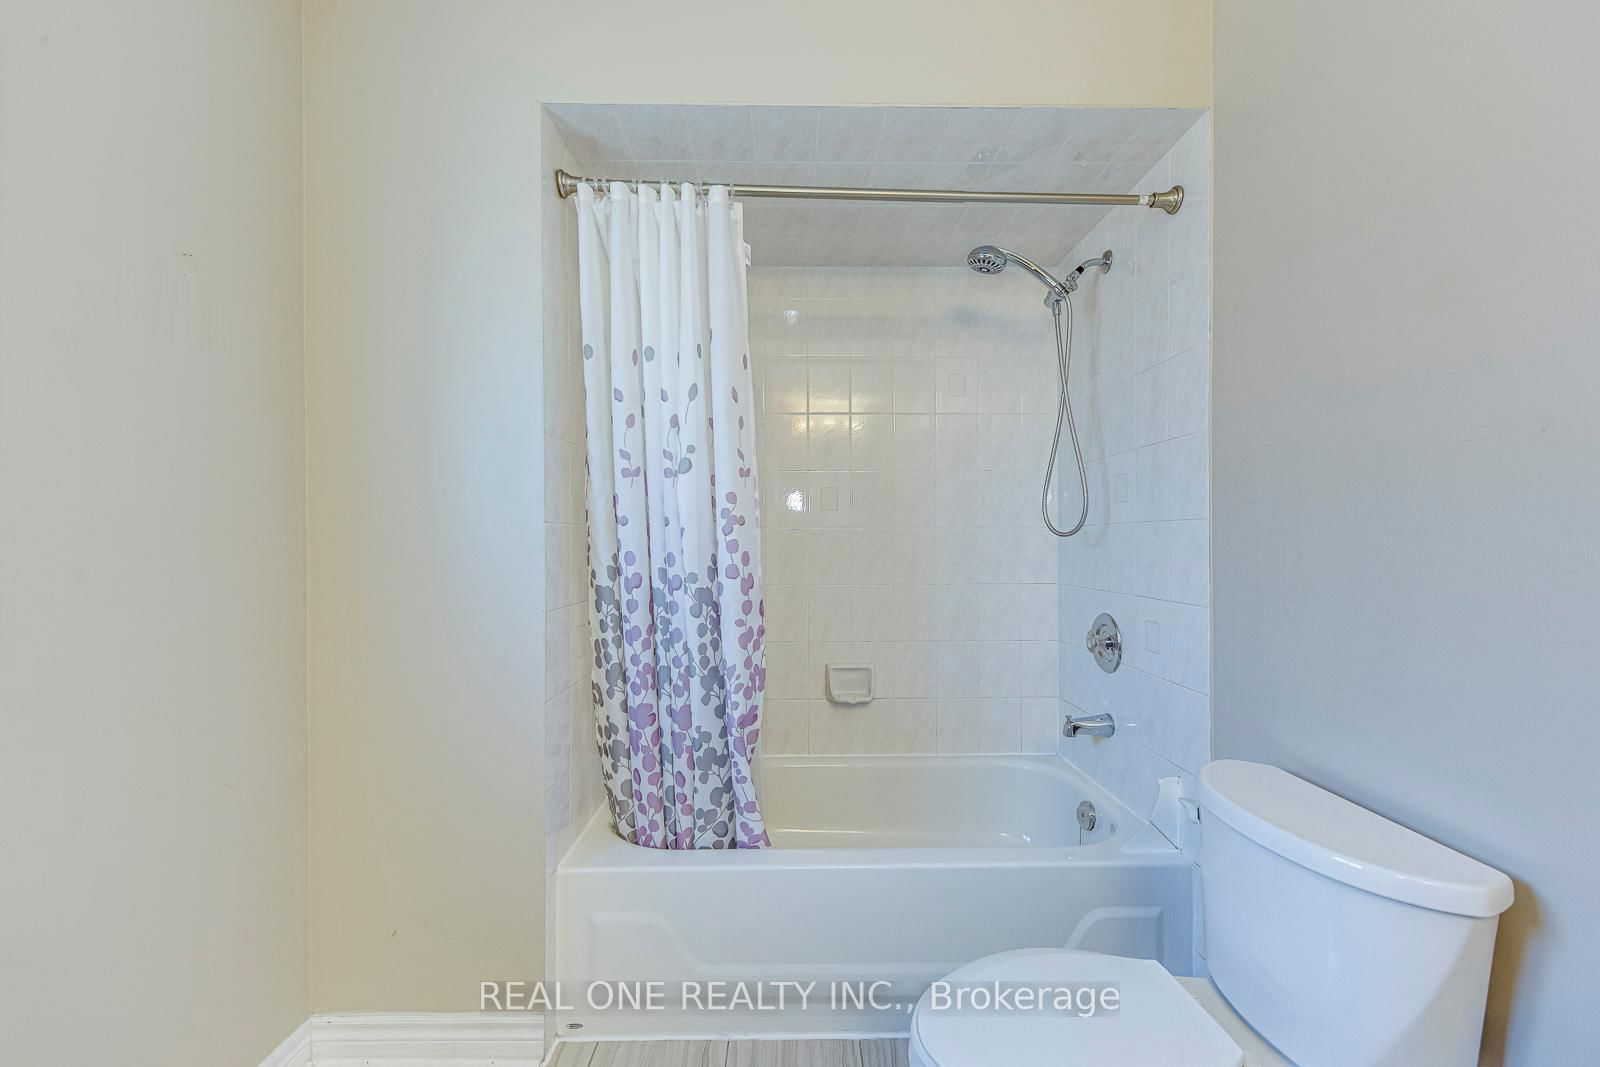
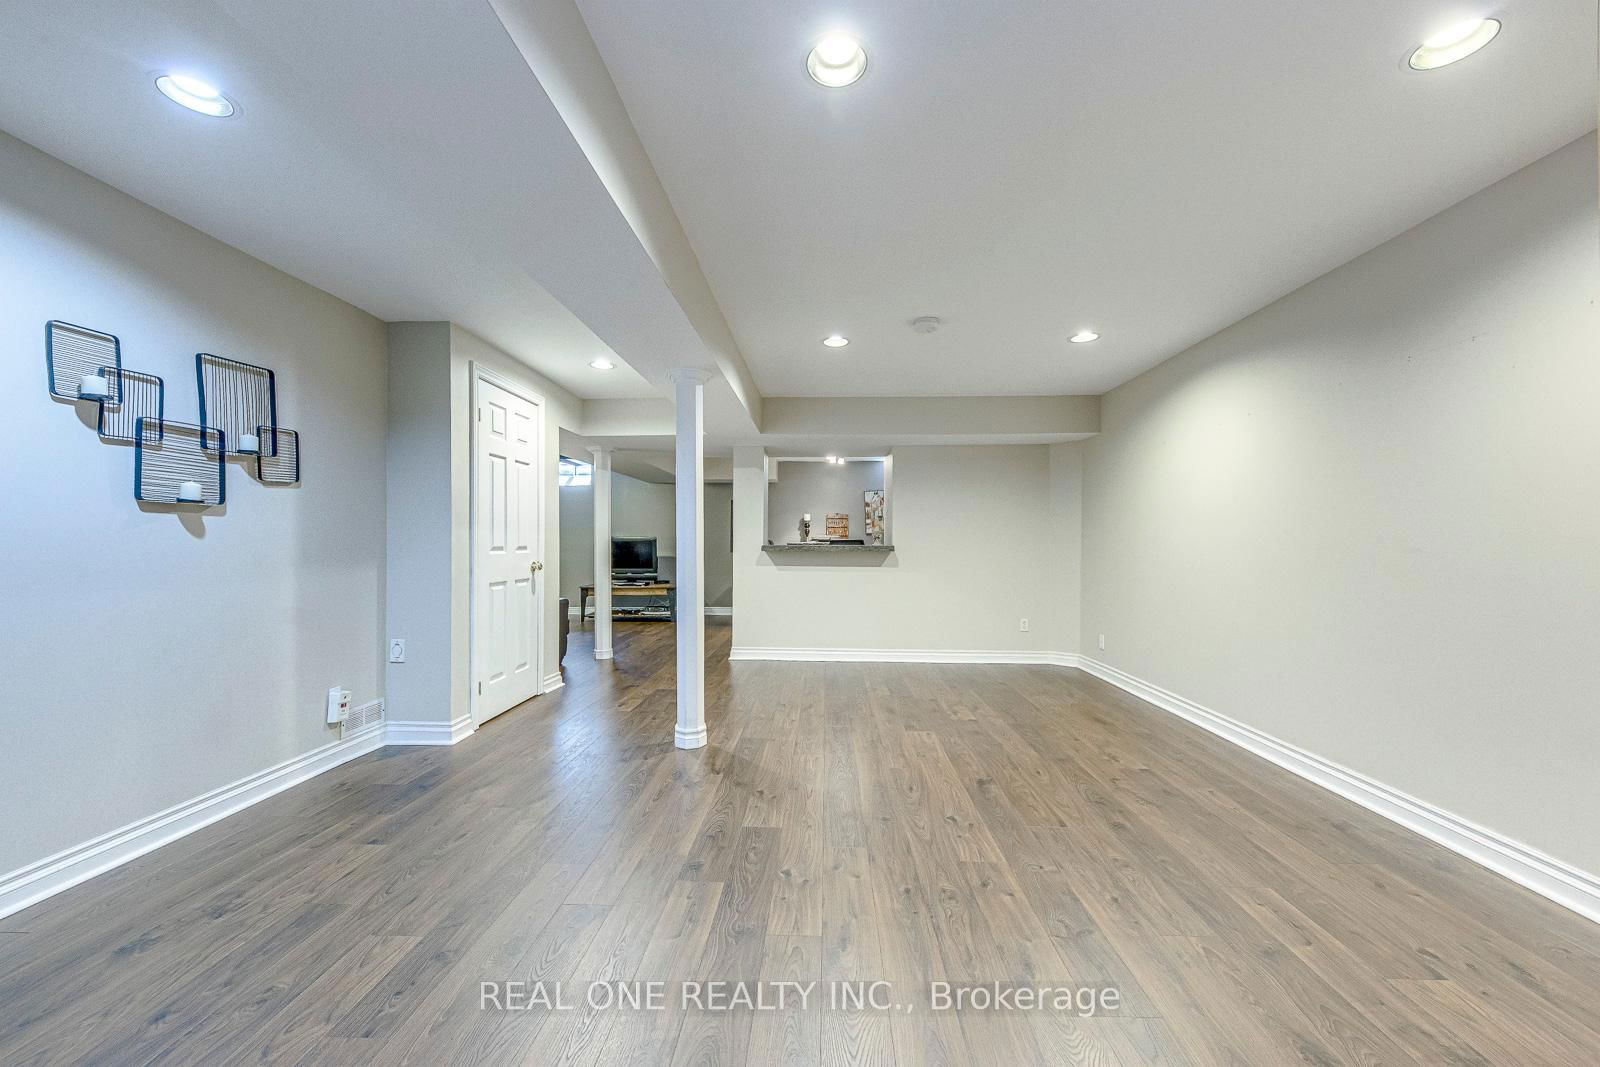
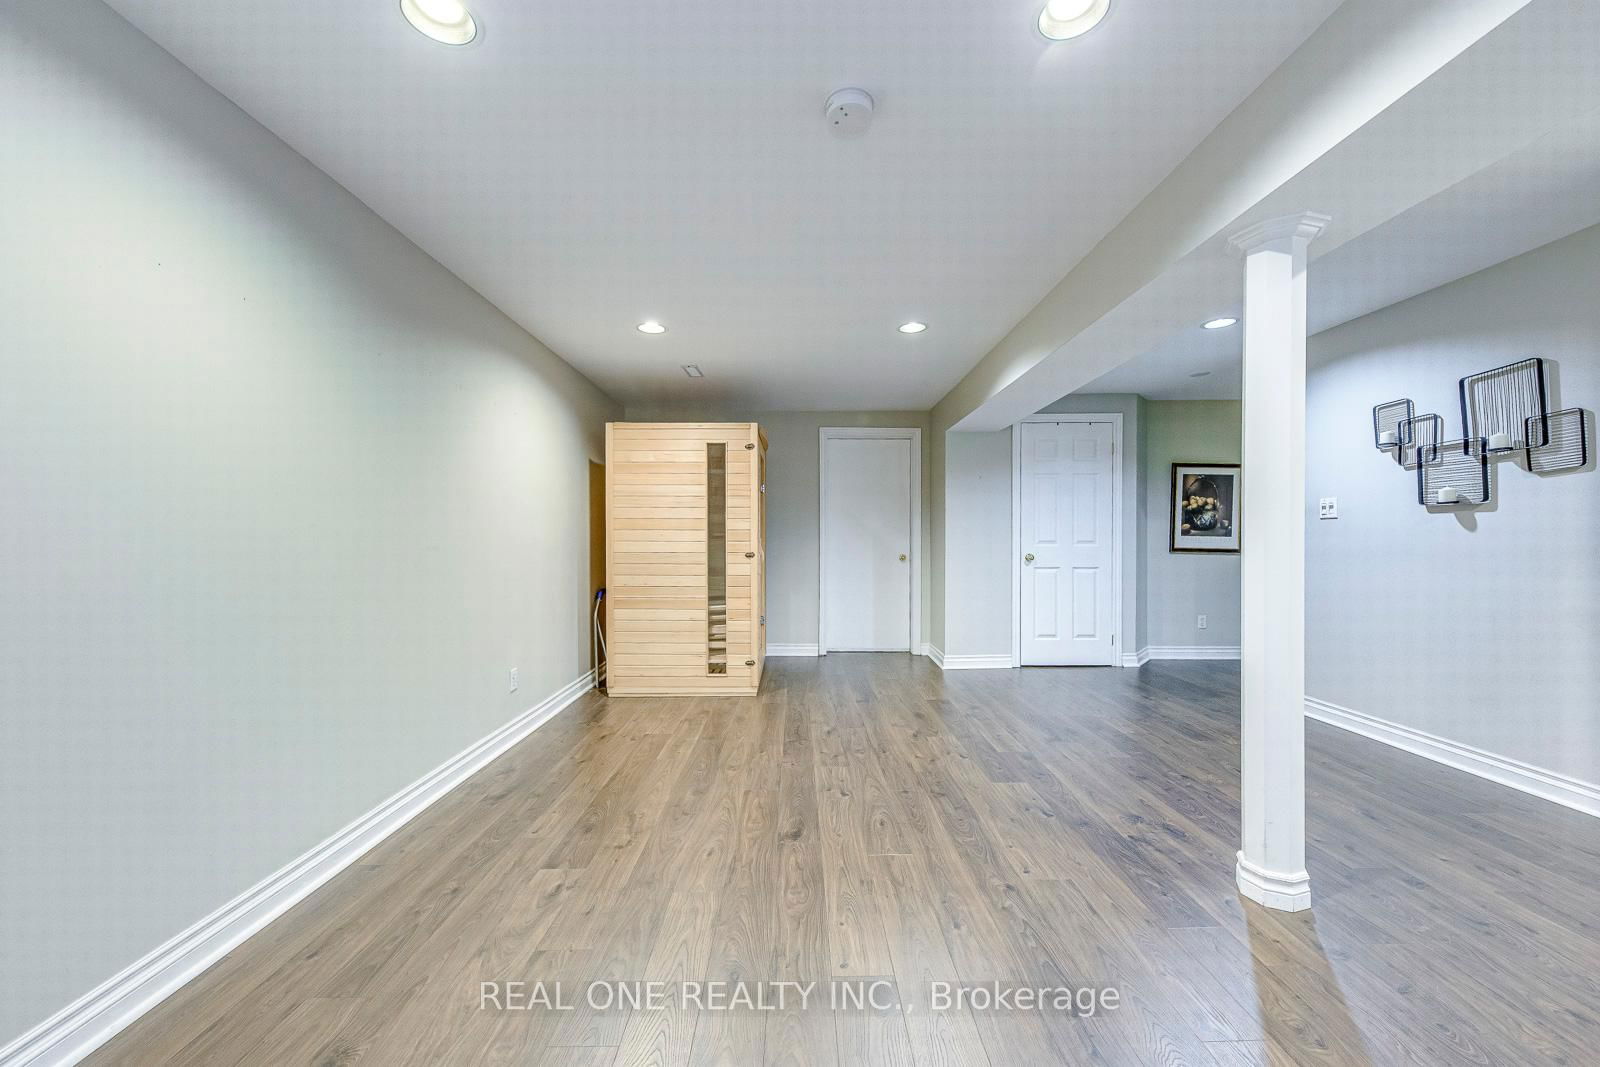
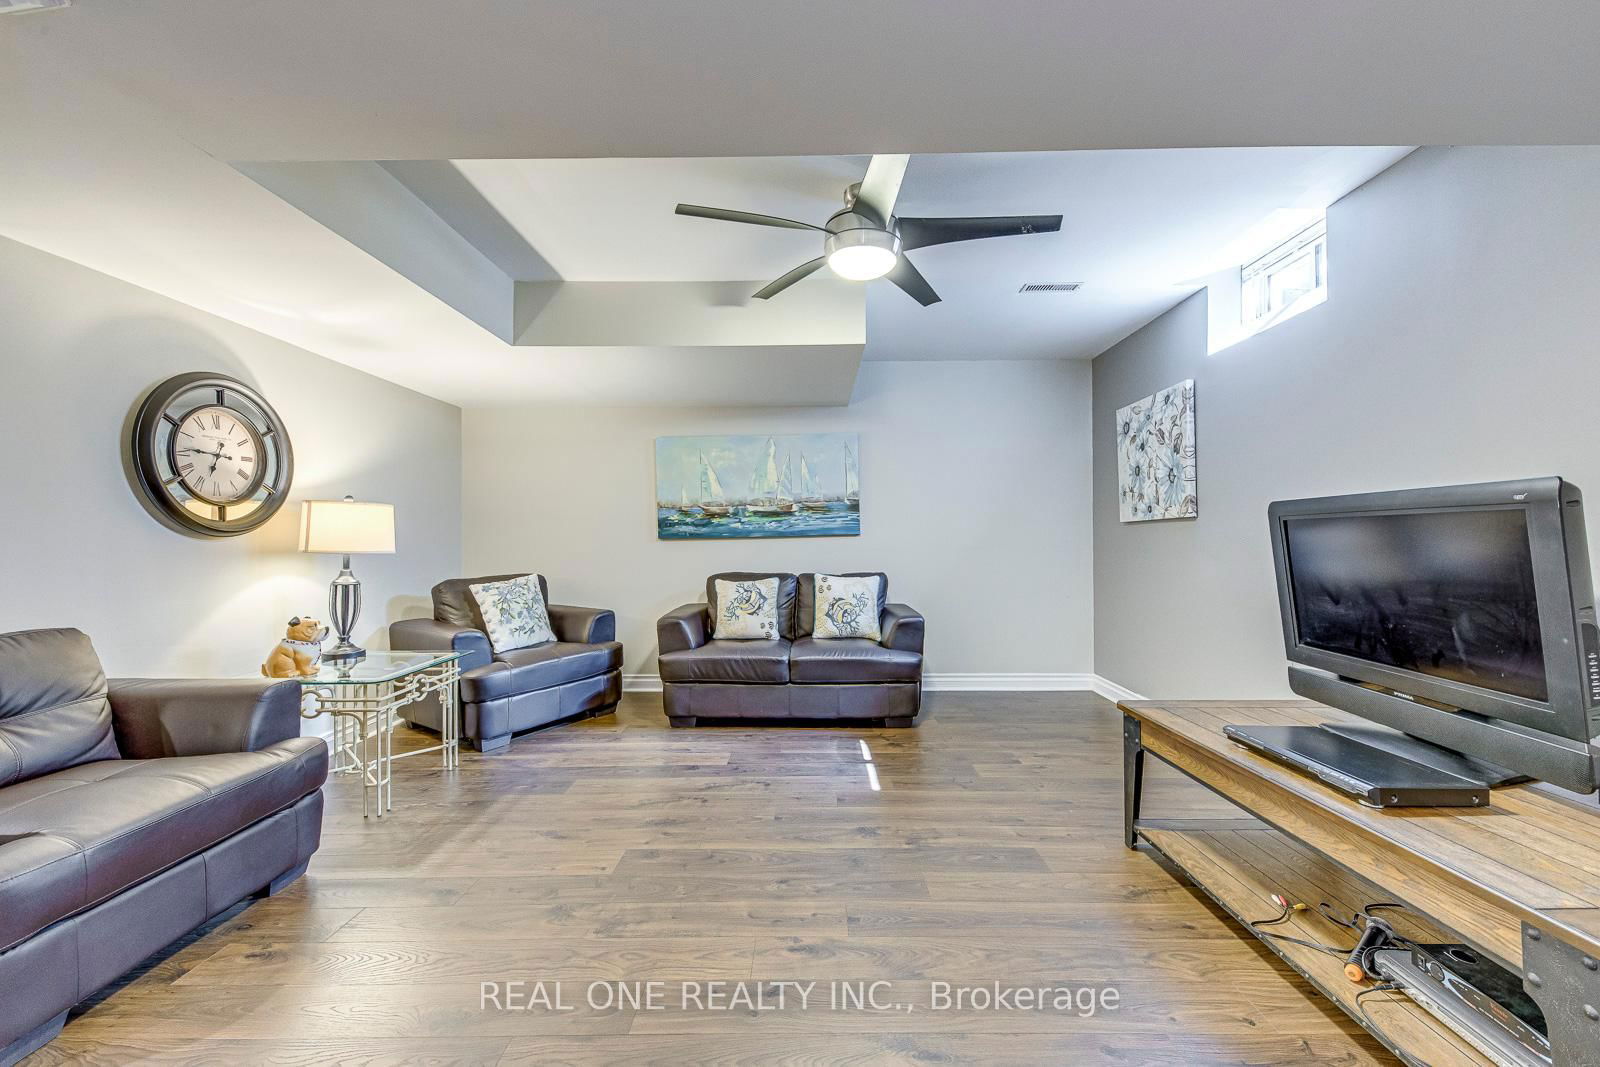
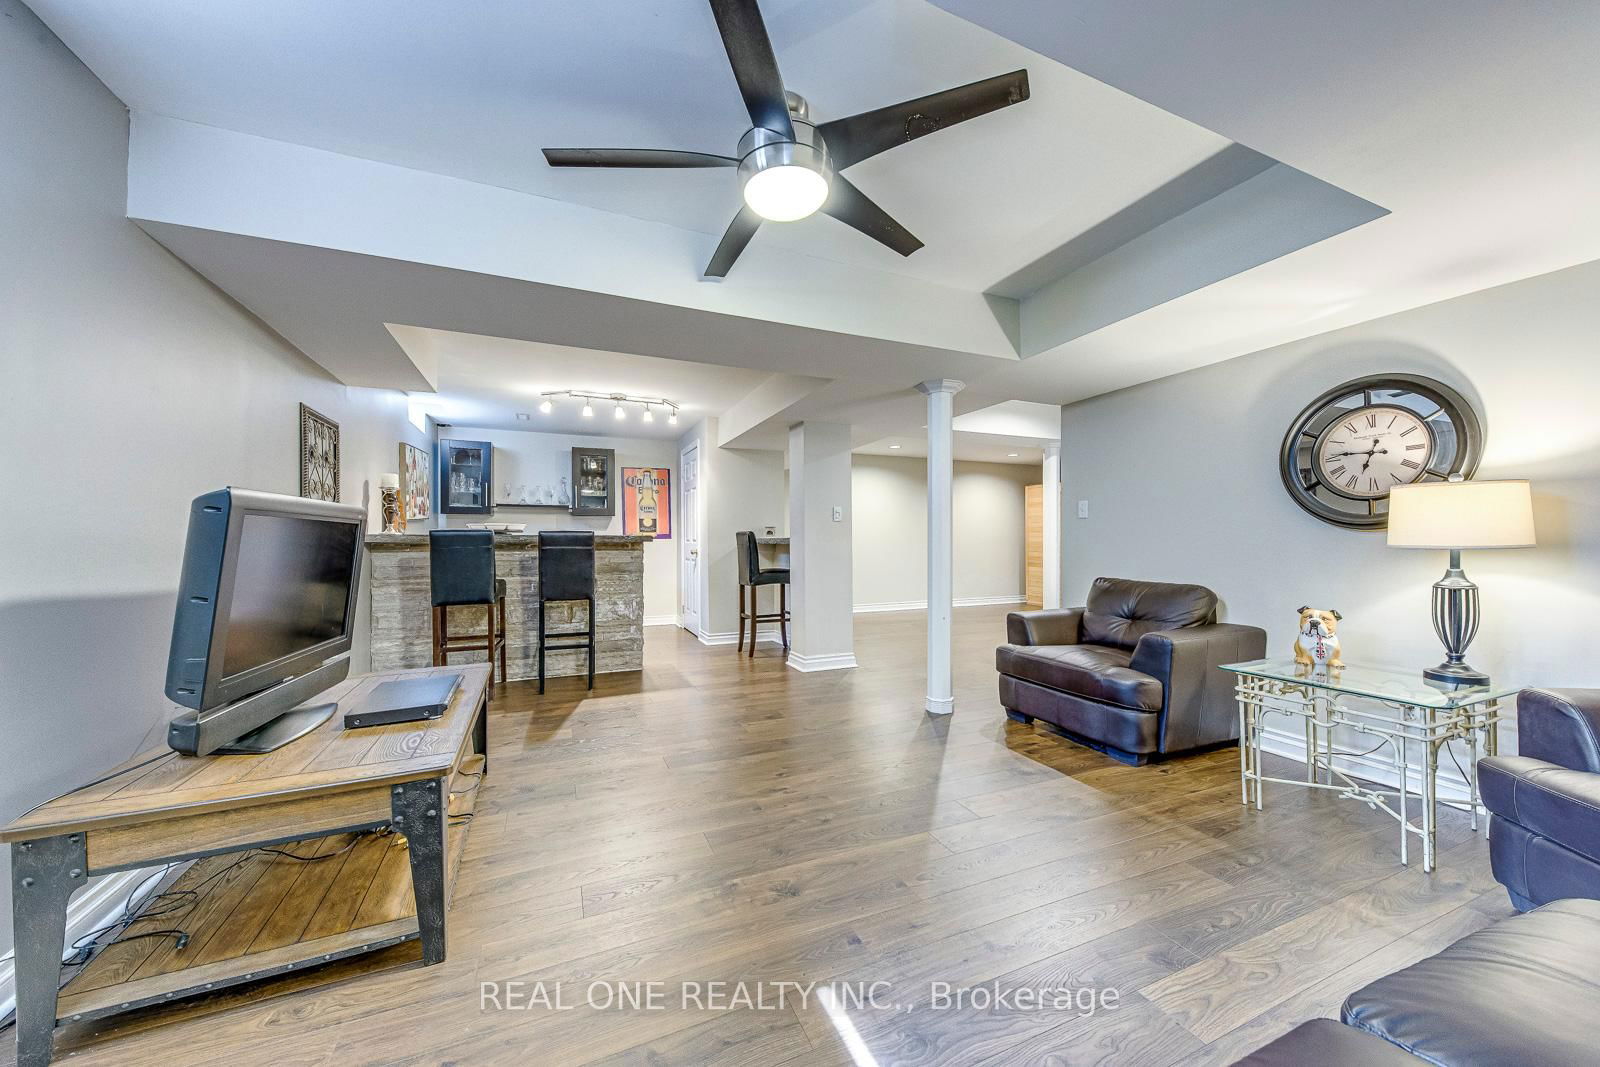
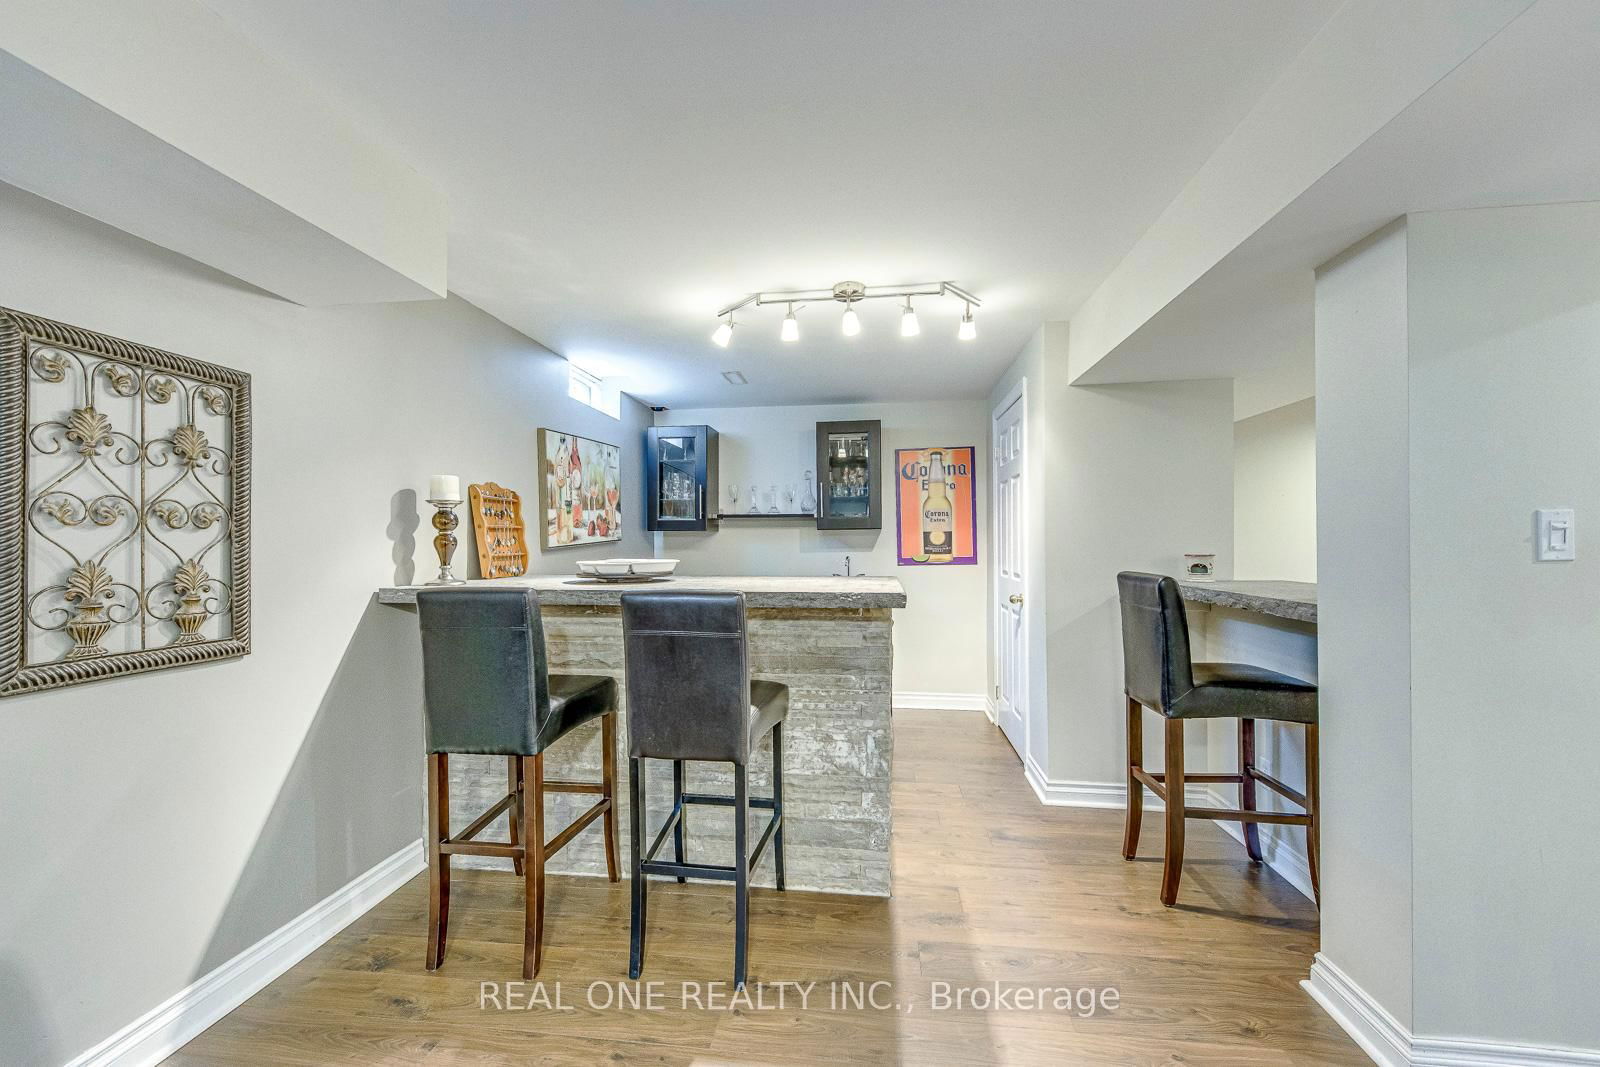
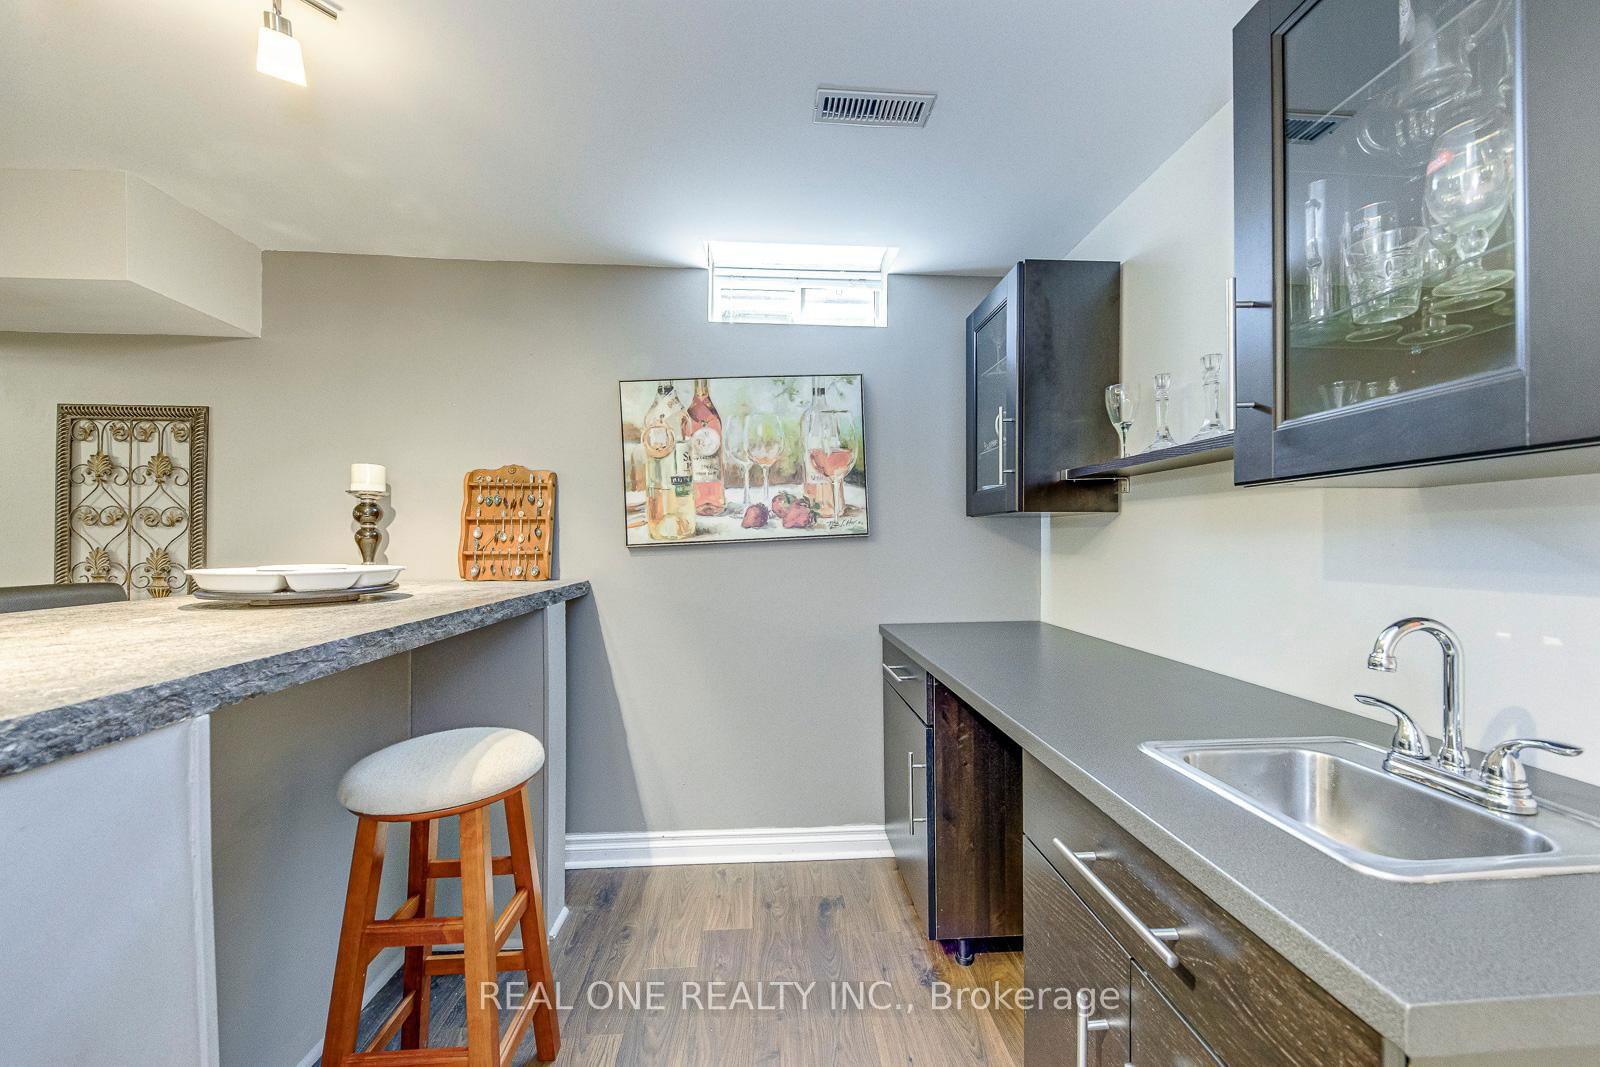
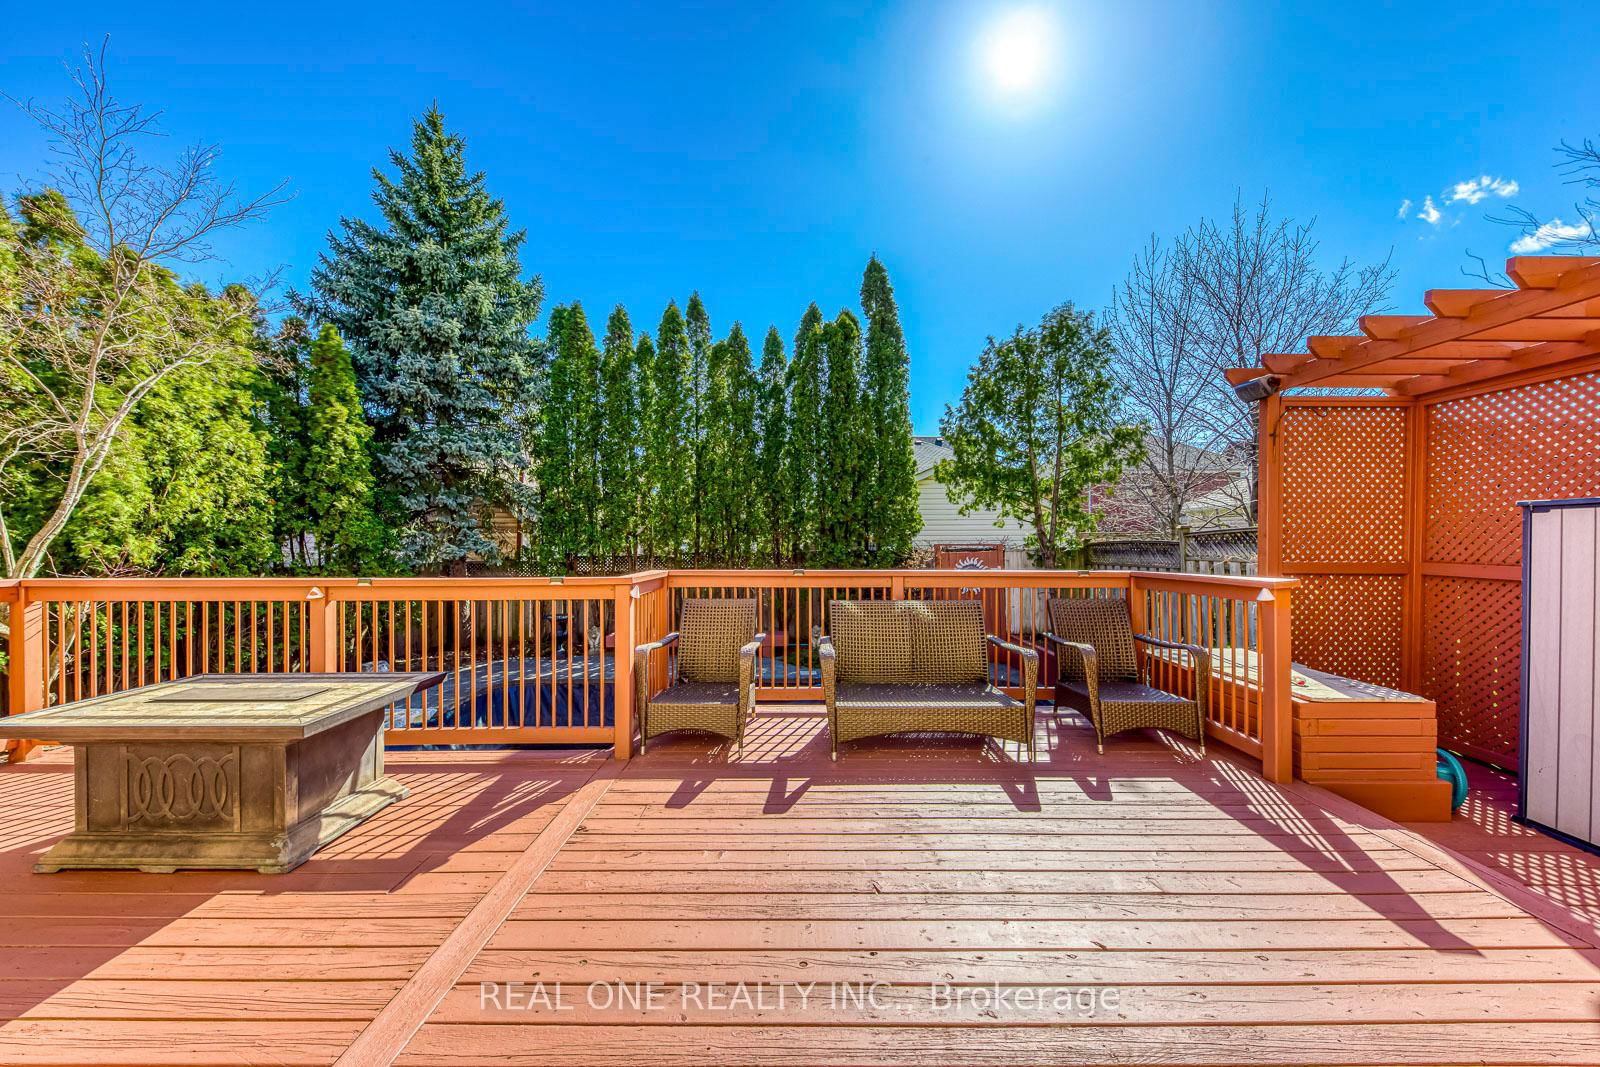
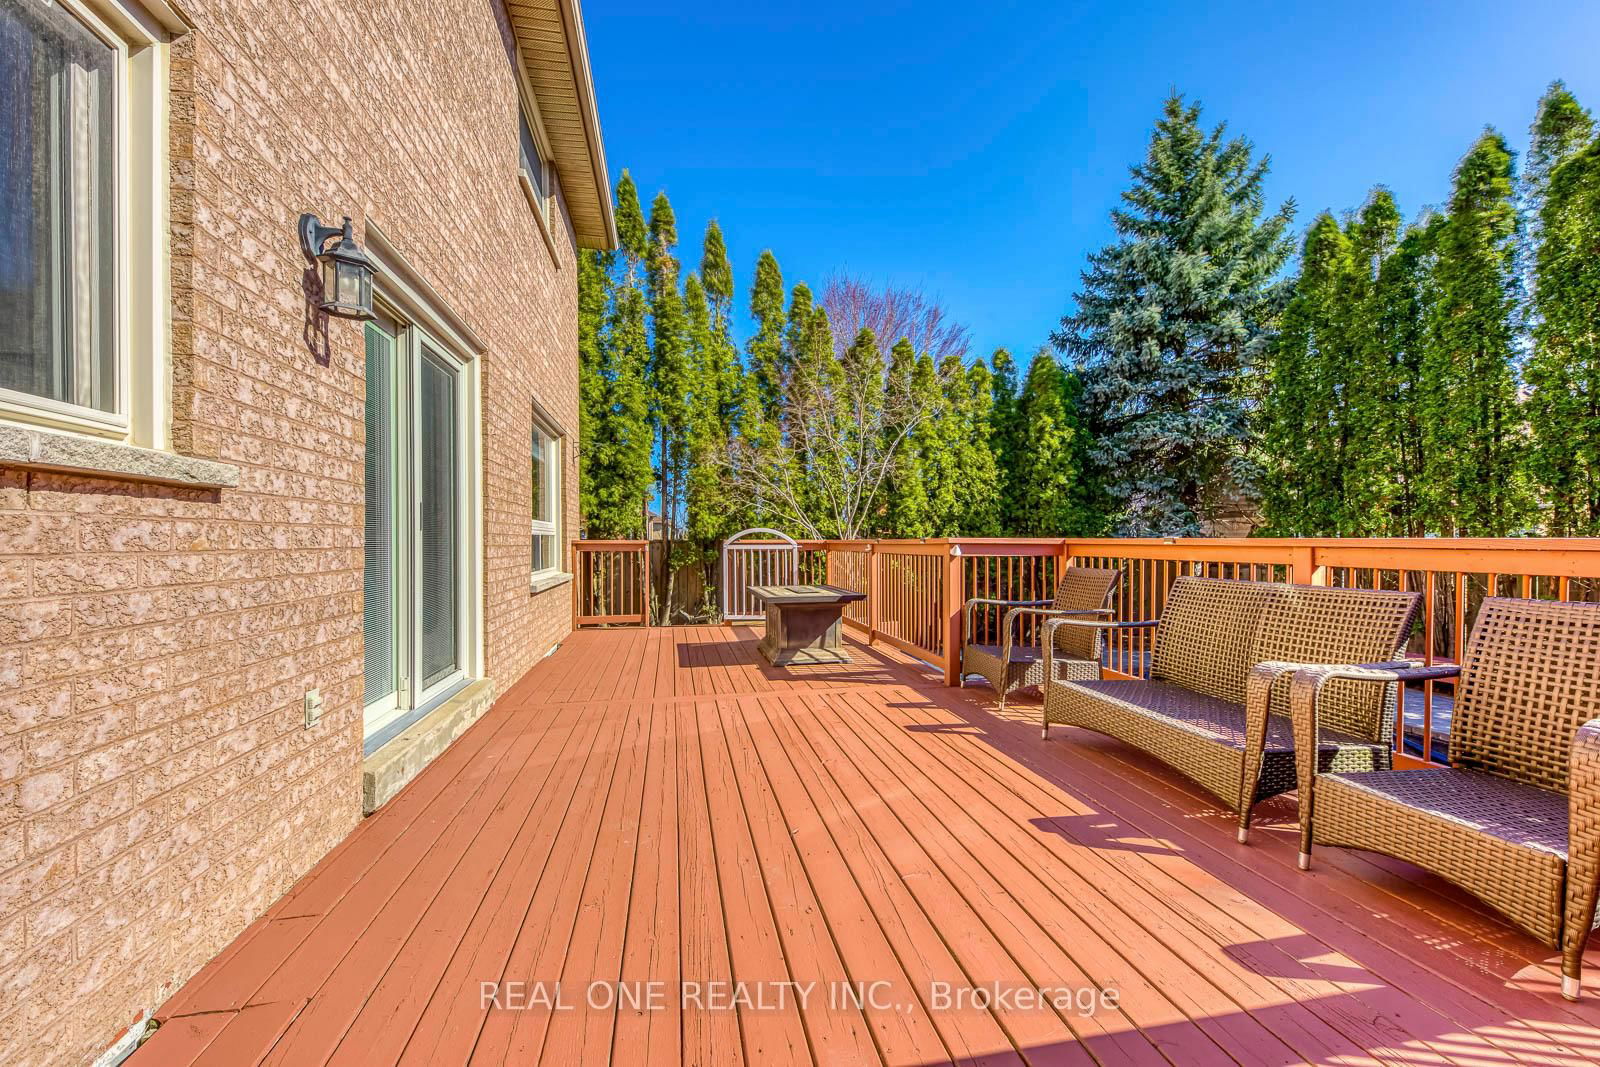
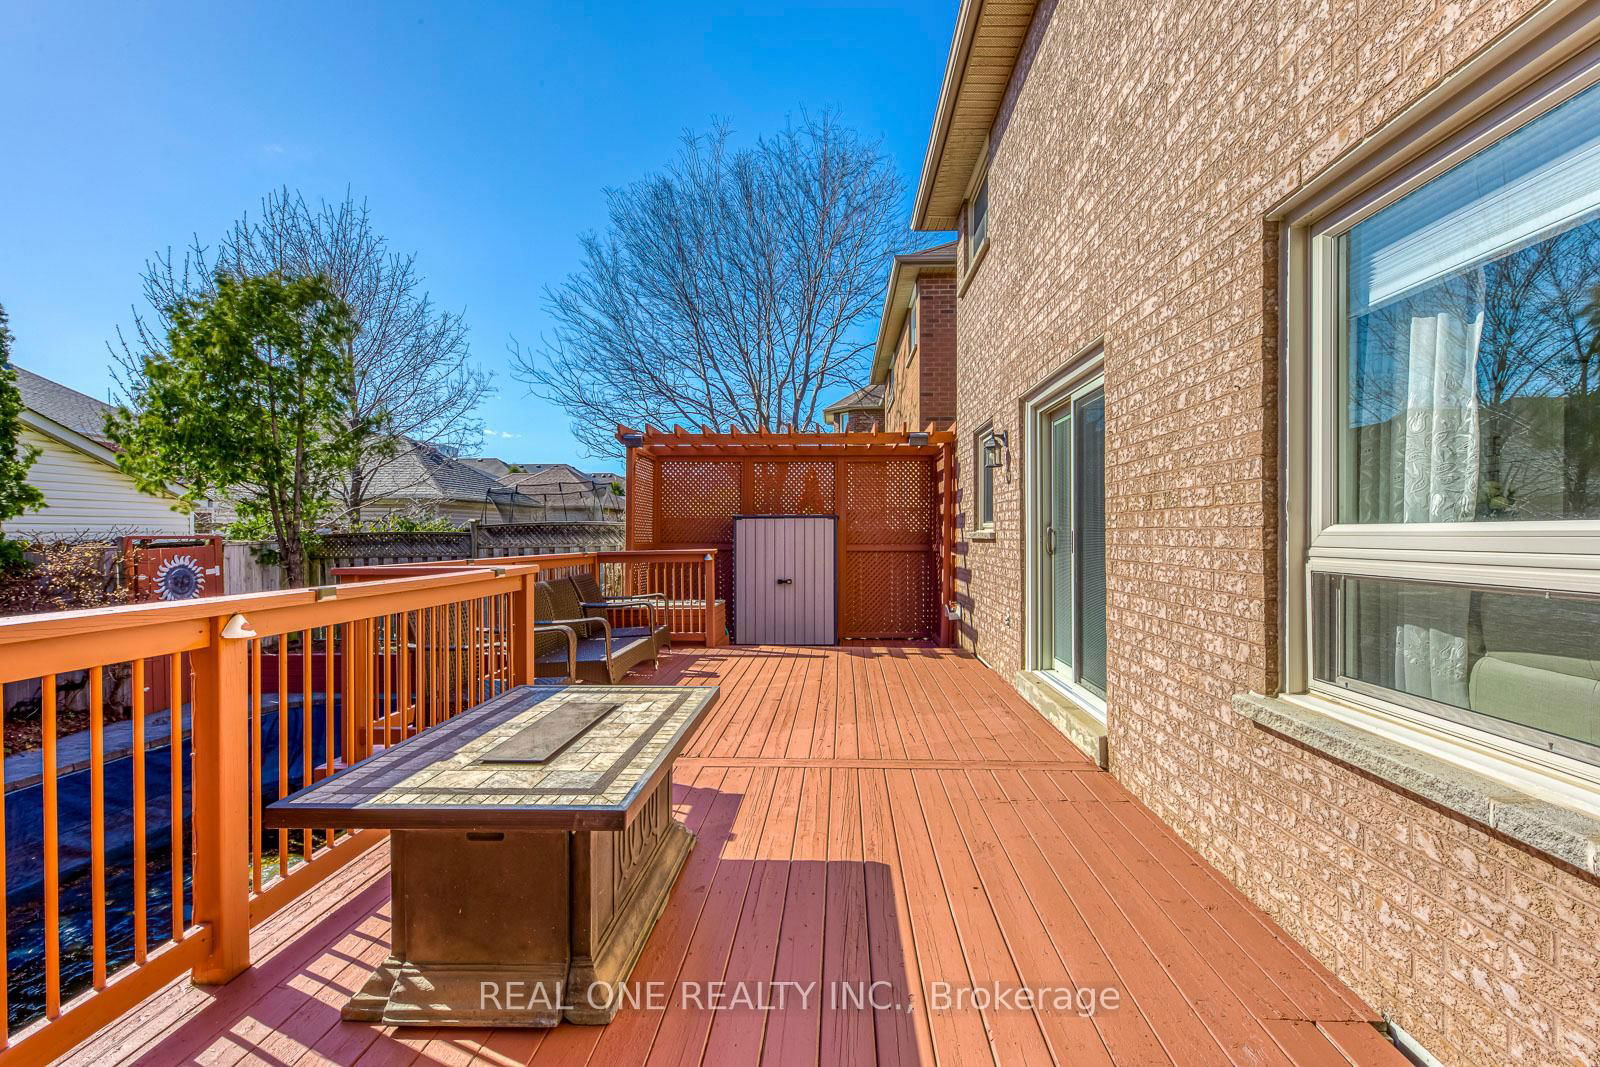
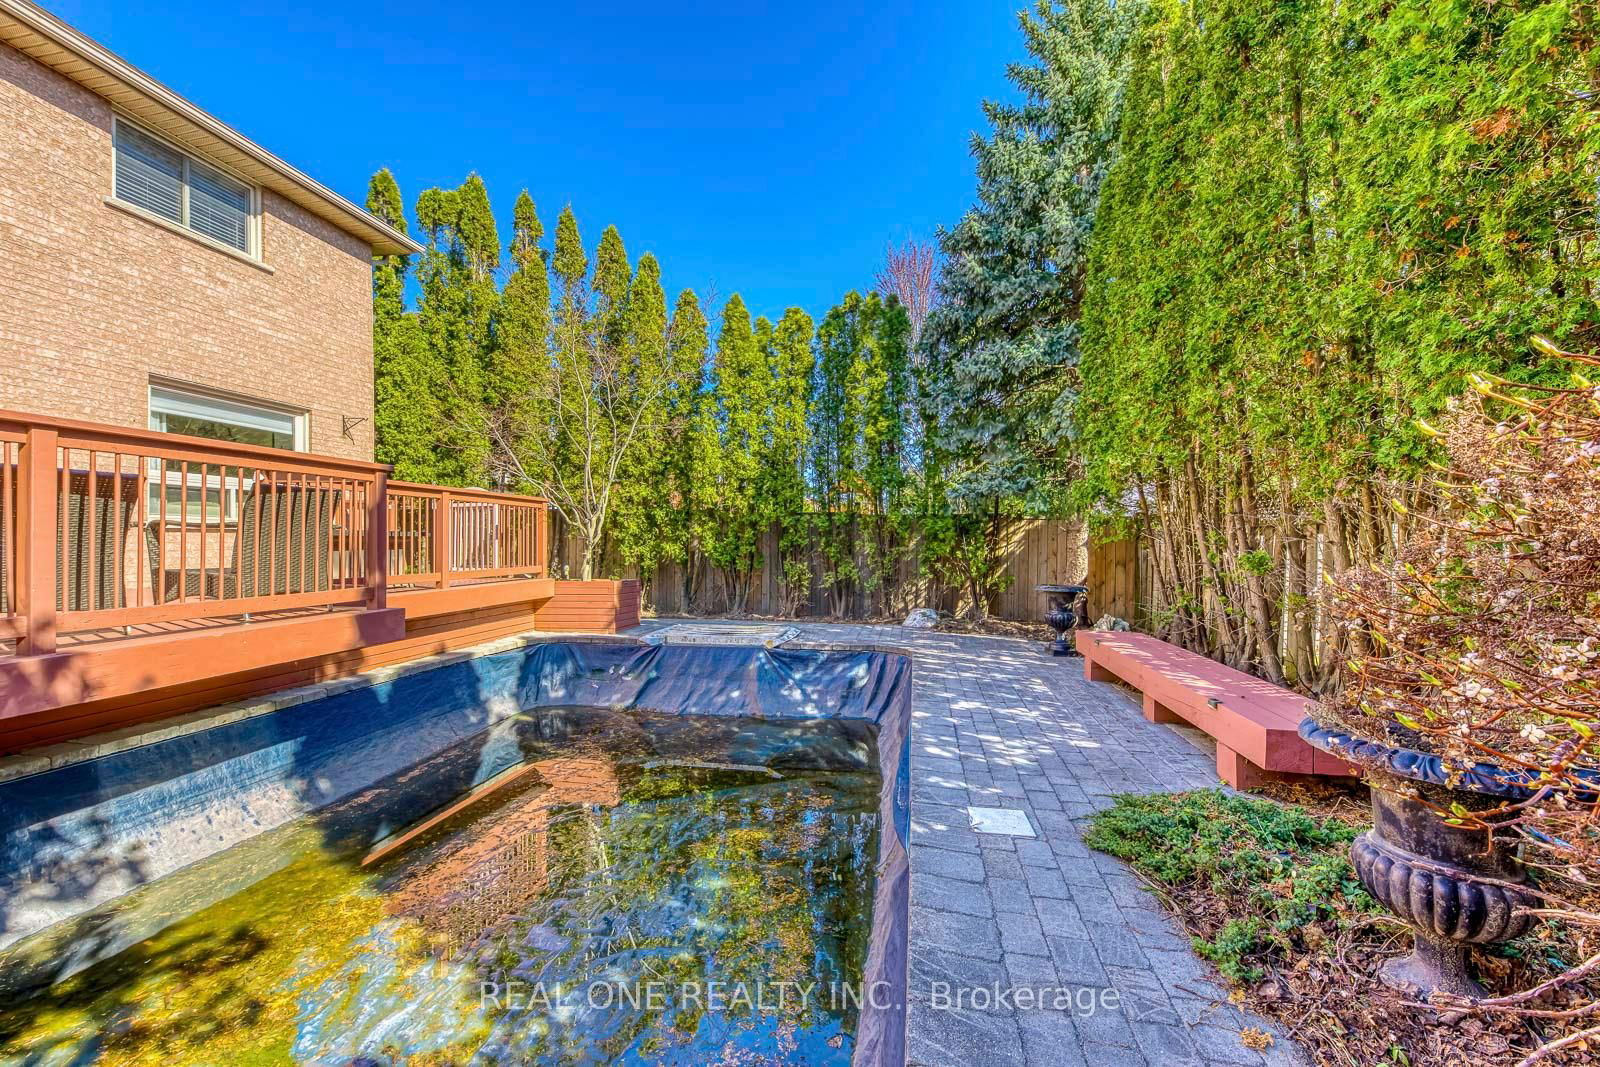
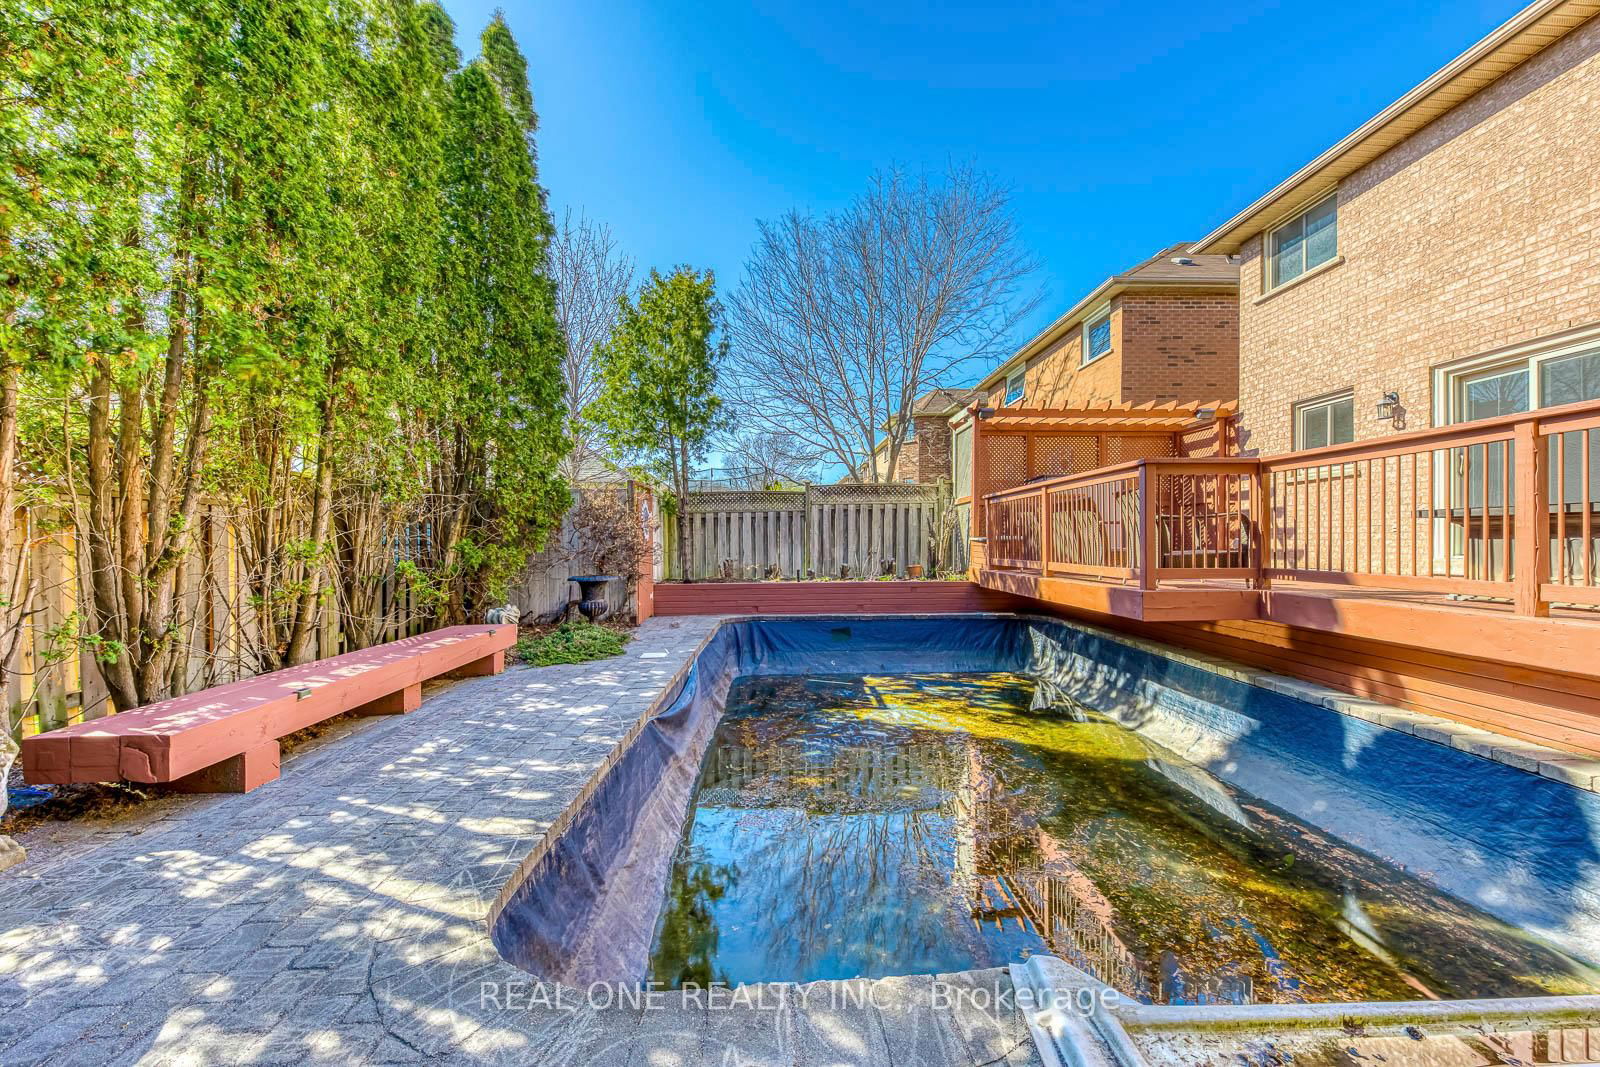
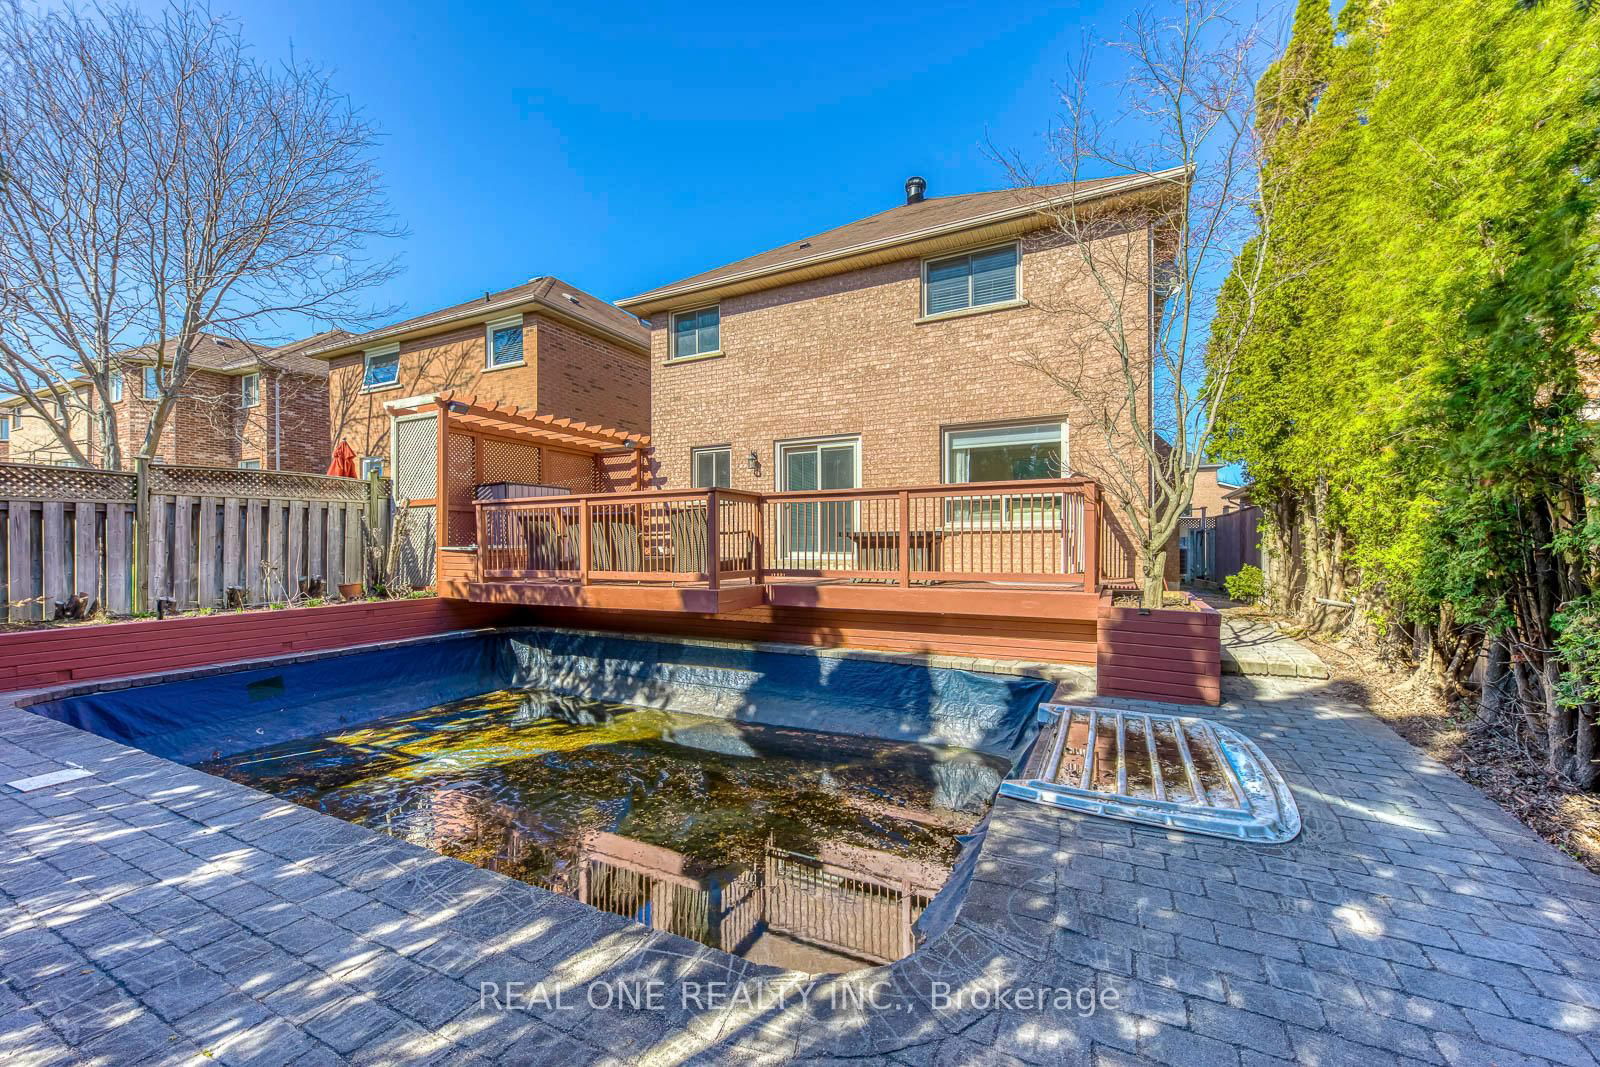
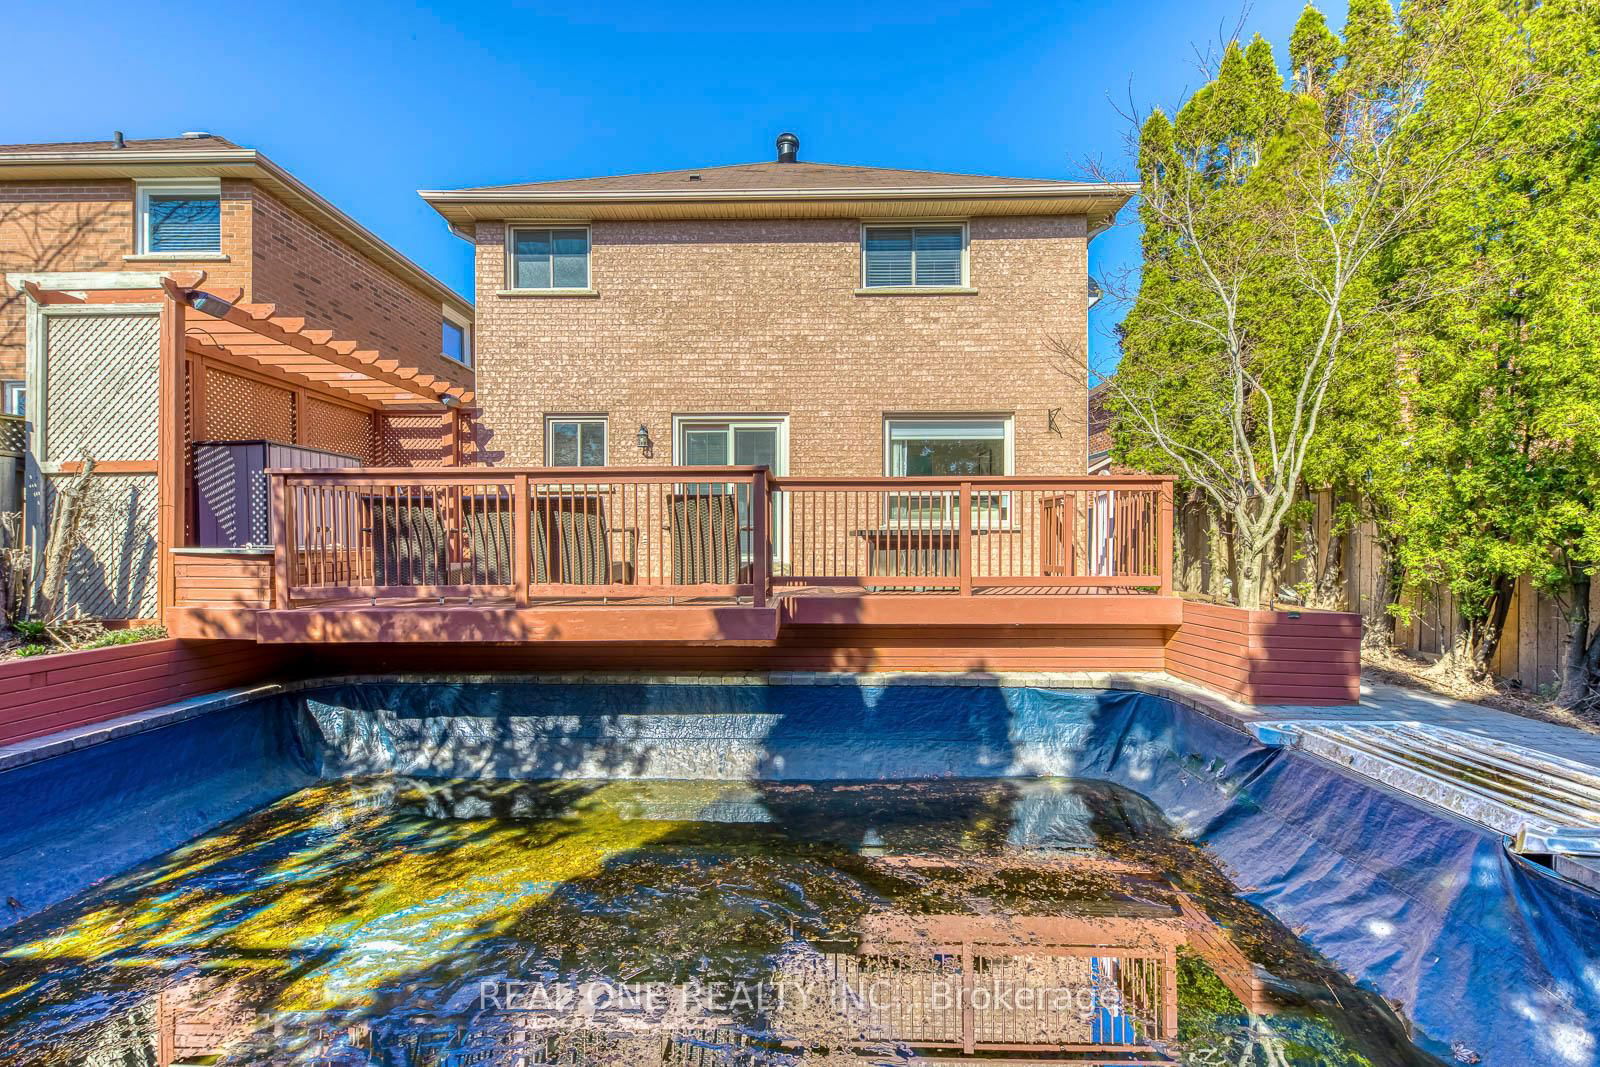
5 Elite Picks! Here Are 5 Reasons to Make This Home Your Own: 1. Spacious Kitchen Featuring Porcelain Tile Flooring, Granite Countertops, Classy Tile Backsplash, Stainless Steel Appliances & Breakfast Area with B/I Breakfast Bar & W/O to Deck. 2. Generous Principal Rooms with Crown Moulding & Hardwood Flooring, Including Spacious F/R with Gas Fireplace & Picture Window Overlooking the Backyard, Plus Bright Combined Open Concept Dining Room & Living Room Area. 3. 4 Good-Sized Bedrooms on 2nd Level, with Spacious Primary Suite Boasting W/I Closet & Stunning 4pc Ensuite with Large Soaker Tub & Glass-Enclosed Shower. 4. Lovely Finished Bsmt Featuring Open Concept Rec & Games Room with Custom Stone Wet Bar Area! 5. Lovely Backyard Retreat on Private Lot with Large Deck, Mature Trees for Ample Privacy, Patio Area & I/G Pool with Auto Filtering & Heating! All This & More! 2pc Powder Room & Laundry Room Complete the Main Level. Over 3,000 Sq.Ft. of Finished Living Space! Furnace & A/C '23, Main Bath Flooring '23, Washer & Dryer '22, Pool Robot '22, New Front Door '21. Fabulous Location on Quiet, Tree-Lined Street in Mature River Oaks Neighbourhood Just Minutes from Many Parks & Trails, Golf, River Oaks Community Centre, Top Schools (Including White Oaks SS), Shopping & Many More Amenities!
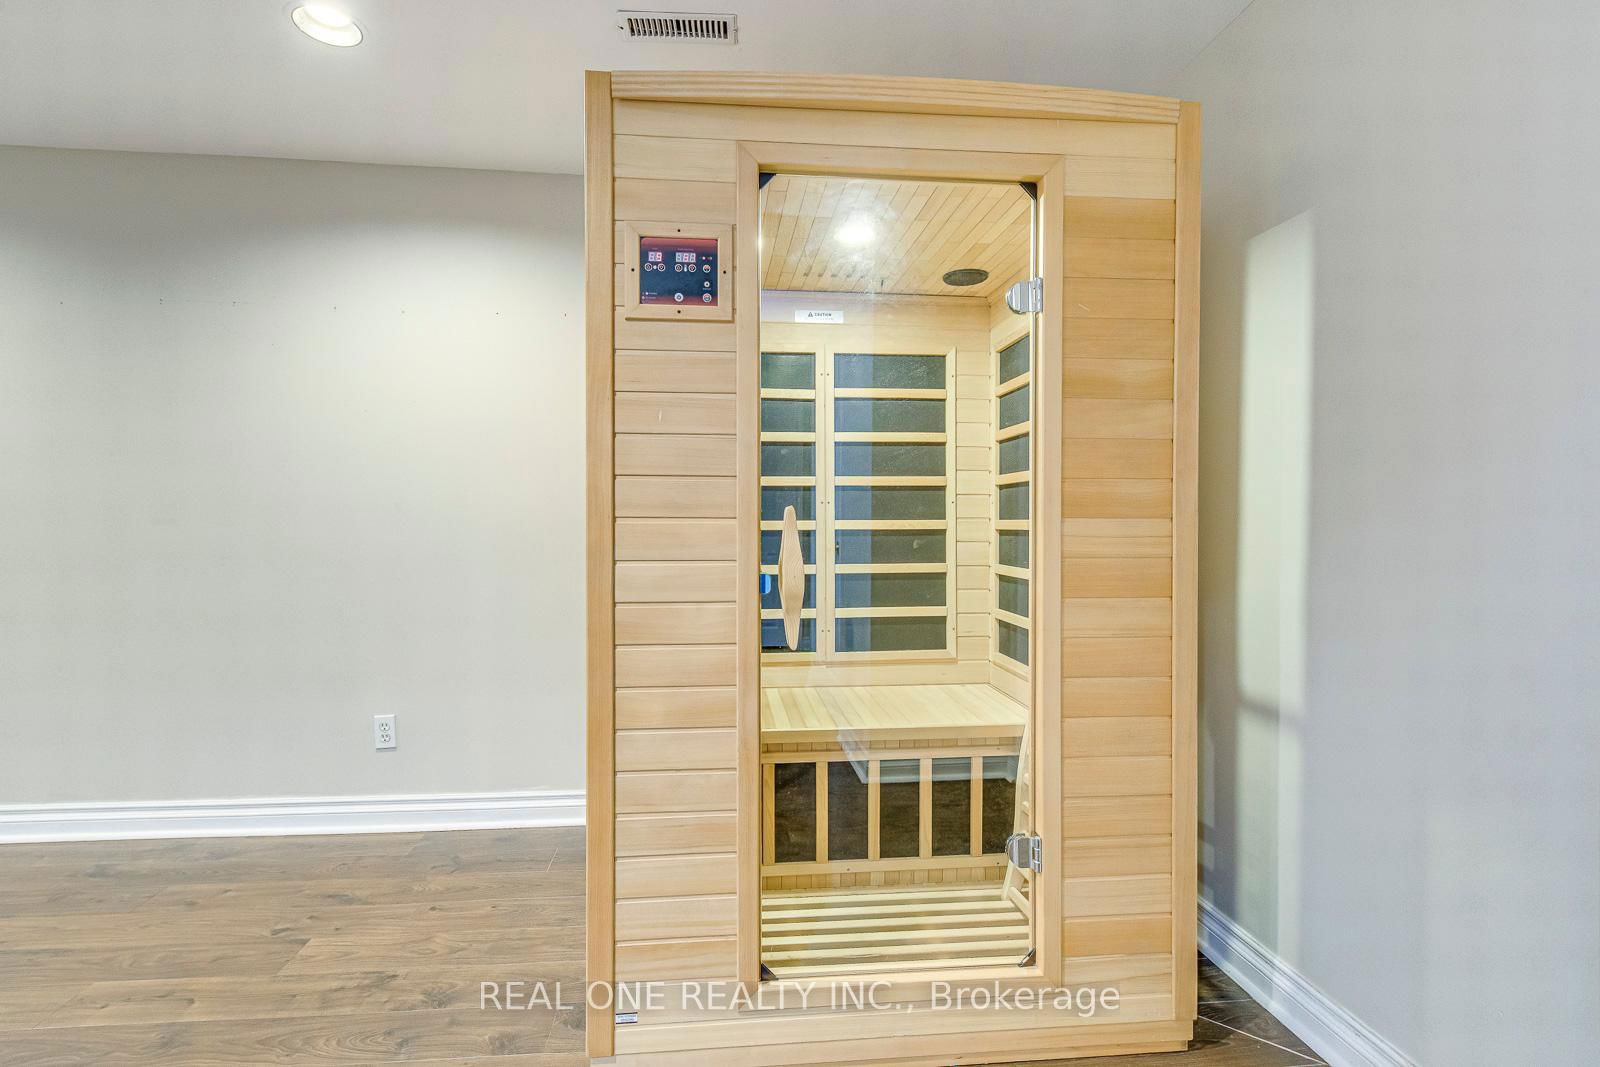
All Light Fixtures & Ceiling Fans, All Window Coverings, Refrigerator & Stove, B/I Dishwasher, B/I Microwave/Hood Fan, Washer & Dryer, Basement Freezer, Sauna, Central Vacuum System & Attachments (As Is), Refrigerator in Garage, 2 Garage Door Openers & Remote(s), All Pool Equipment, Pool Robot Cleaner
Kitchen
Family
Dining
Living
Primary
2nd Br
3rd Br
4th Br
Rec
Games
The graph below compares the average list price and average sale price of homes in this neighborhood by month for the last 24 months. When average sale price is greater than average list price, this may suggest a buyer's market. When average sale price is lower than the average list price this may suggest a seller's market.
The graph below illustrates the average days on market for homes in this neighborhood. The yellow area may indicate a buyer's market, the green area may indicate a balanced market and the red area may indicate a seller's market.
Sales Representative, Century 21 People’s Choice Realty Inc., Brokerage
(647) 576 - 2100
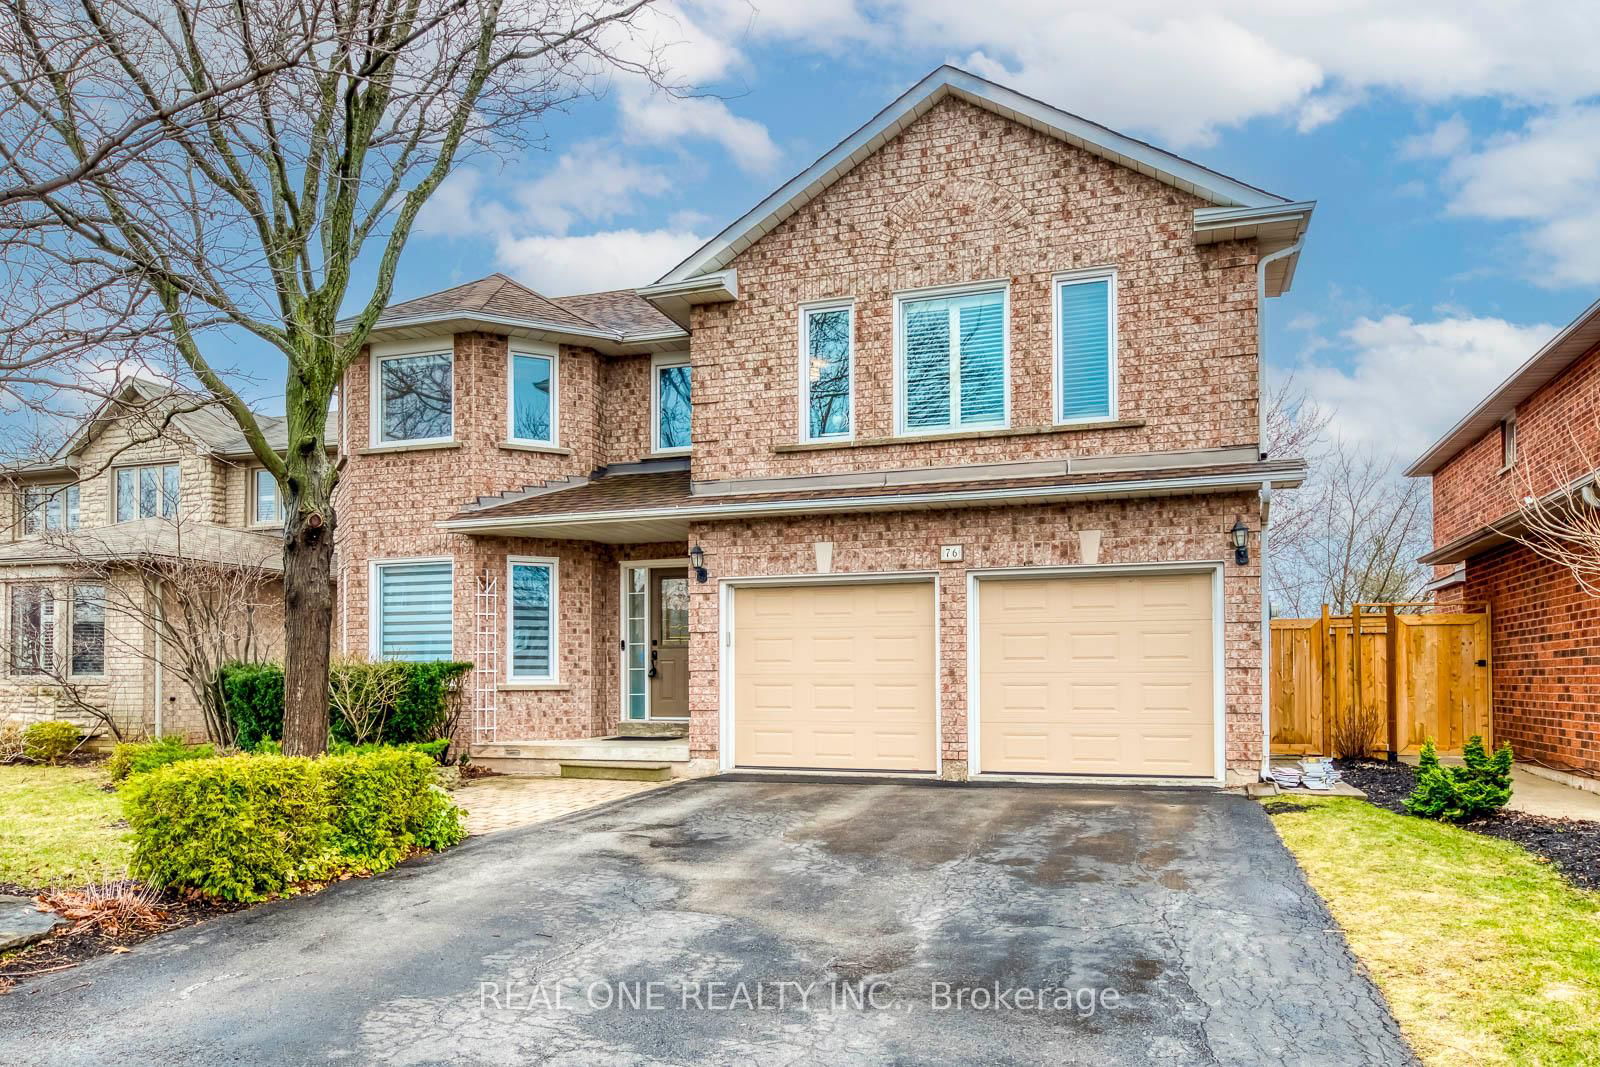
Oakville, WC Wedgewood Creek, L6H 4W2
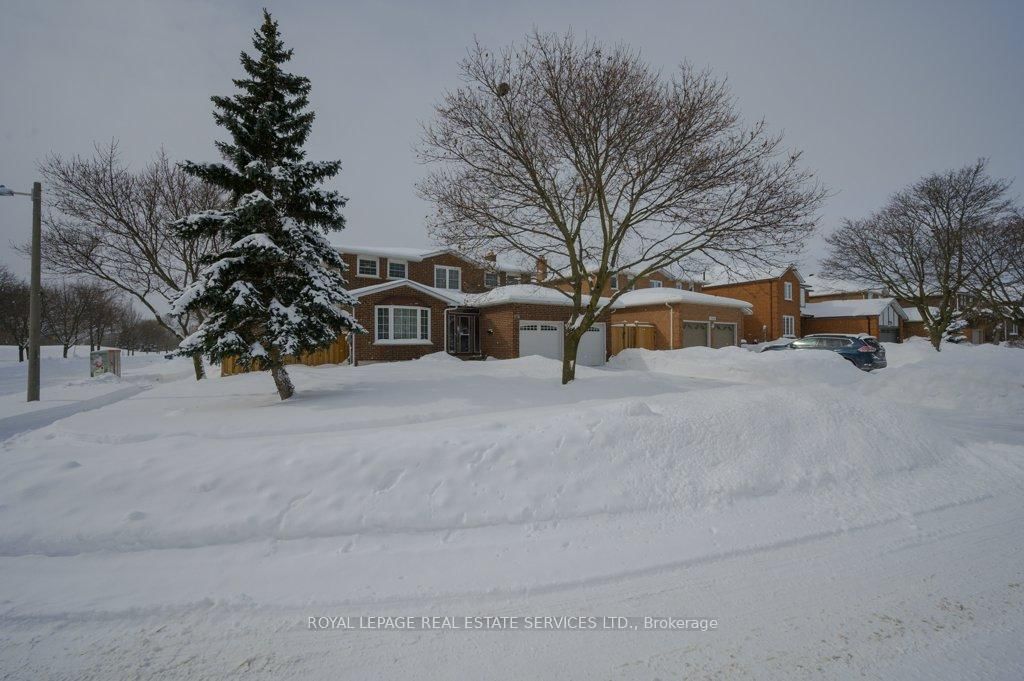
Oakville, JM Joshua Meadows, L6H 0S1
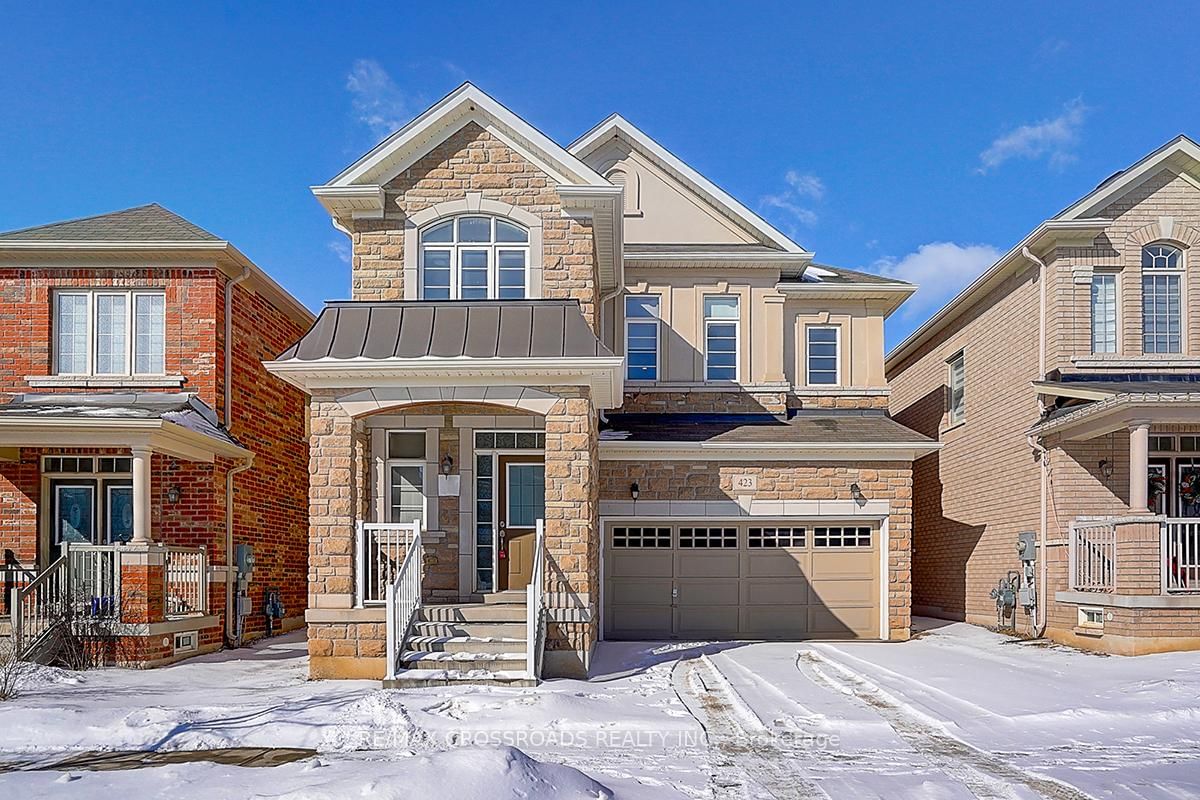
Oakville, JM Joshua Meadows, L6H 0S7
Oakville, WC Wedgewood Creek, L6H 3X9
Oakville, GO Glenorchy, L6H 3R1
Oakville, WT West Oak Trails, L6M 3L8